
Today’s healthcare ecosystem generates enormous amounts of data, ranging from electronic health records and lab reports to imaging files and clinical trial outputs. According to a 2024 report from MarketsandMarkets, the global healthcare analytics market is projected to grow from USD 36.3 billion in 2023 to USD 94.8 billion by 2028 at a CAGR of 21.4%, reflecting how rapidly data-driven decision-making is reshaping healthcare.
In this data-rich environment, Statistical Analysis in Healthcare plays a crucial role in transforming raw medical information into meaningful insights. It helps clinicians interpret patterns, validate observations, evaluate treatment outcomes, and support evidence-based decisions. Instead of leaving hospitals with scattered vitals, lab values, and clinical observations, statistical techniques bring structure and clarity to complex datasets.
As healthcare organizations adopt digital tools, analytics, and AI-powered platforms, the need to extract reliable insights from data becomes even more essential. Statistical analysis ensures that clinical decisions, hospital planning, and research outcomes are built on solid evidence, making it the backbone of modern medical practice.
What is Statistical Analysis in Healthcare?
Statistical Analysis in Healthcare refers to the use of mathematical and computational techniques to collect, organize, and interpret medical data. It converts raw information, such as lab results, patient records, and clinical trial observations, into meaningful insights that support better decision-making across hospitals and research settings.
Statistical analysis is essential for evaluating patient outcomes, measuring treatment effectiveness, tracking disease patterns, and improving hospital operations. It forms the backbone of evidence-based medicine. Whether used in clinical research, public health studies, statistical methods help healthcare professionals identify patterns, make accurate predictions, and enhance the overall quality of care.
Major Workflow Components and Tools in Healthcare Statistics
1. Data Collection
Data collection is the foundation of statistical analysis in healthcare. gathers information from multiple clinical and operational systems, EHRs, lab platforms, imaging devices, wearables, and clinical trial systems, to build a complete picture of patient health. The accuracy of all downstream analysis depends on how well data is captured at this stage.
Data is pulled from every patient interaction: consultations, diagnostics, prescriptions, lab reports, vital signs, and trial observations. These inputs are entered into hospital systems or research platforms and moved into central databases where they can be accessed for analysis.
Applications Used for data collection
| Category | Applications |
|---|---|
| EDC Systems (Clinical Trials) | Medidata Rave, Oracle Clinical |
| Hospital Information Systems (HIS) | HIS platforms, EHR systems |
| Wearable/Remote Monitoring Systems | Device-generated continuous health data |
2. Data Cleaning & Preparation
Data cleaning and preparation ensure that raw healthcare data becomes accurate, complete, and consistent. Because medical data often contains missing entries, duplicate results, and format inconsistencies, this step is essential for ensuring reliability before applying statistical methods.
The workflow includes removing duplicates, correcting inconsistencies, handling missing values, standardizing formats, and validating the dataset. Cleaned datasets are then converted into analysis-ready structures that support accurate statistical calculations.
Applications Used for data cleaning and preparation
| Category | Applications |
|---|---|
| Programming Languages | Python (Pandas, NumPy), R |
| Regulatory-Grade Cleaning | SAS (widely used in clinical trials and pharma) |
3. Data Organization & Classification
Organizing and classifying data helps structure patient information into meaningful groups. This stage categorizes patients by demographics, diagnoses, lab results, treatment arms, or symptom clusters to reveal patterns and support comparative analysis.
Cleaned data is sorted, grouped, and labeled based on clinical relevance. Variables are categorized (e.g., age groups, disease stage), and datasets are segmented into cohorts for further analysis.
Applications Used for data organization and classification
| Category | Applications |
|---|---|
| Basic Organizational Tools | Excel, Power BI |
| Statistical Grouping Tools | SPSS (grouping, labeling, descriptive summaries) |
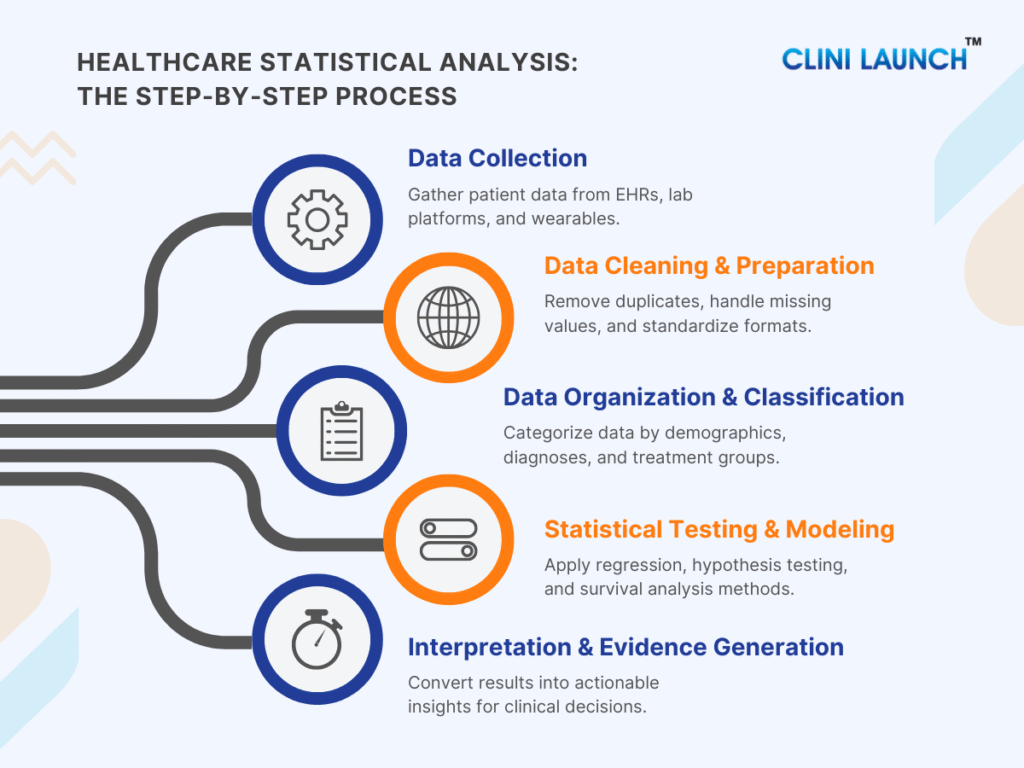
4. Statistical Testing & Modeling
Statistical testing and modeling transform clinical data into reliable insights. Methods such as hypothesis testing, regression modeling, linear regression, logistic regression, and survival analysis help measure treatment impact, identify key risk factors, compare options, and project long-term outcomes.
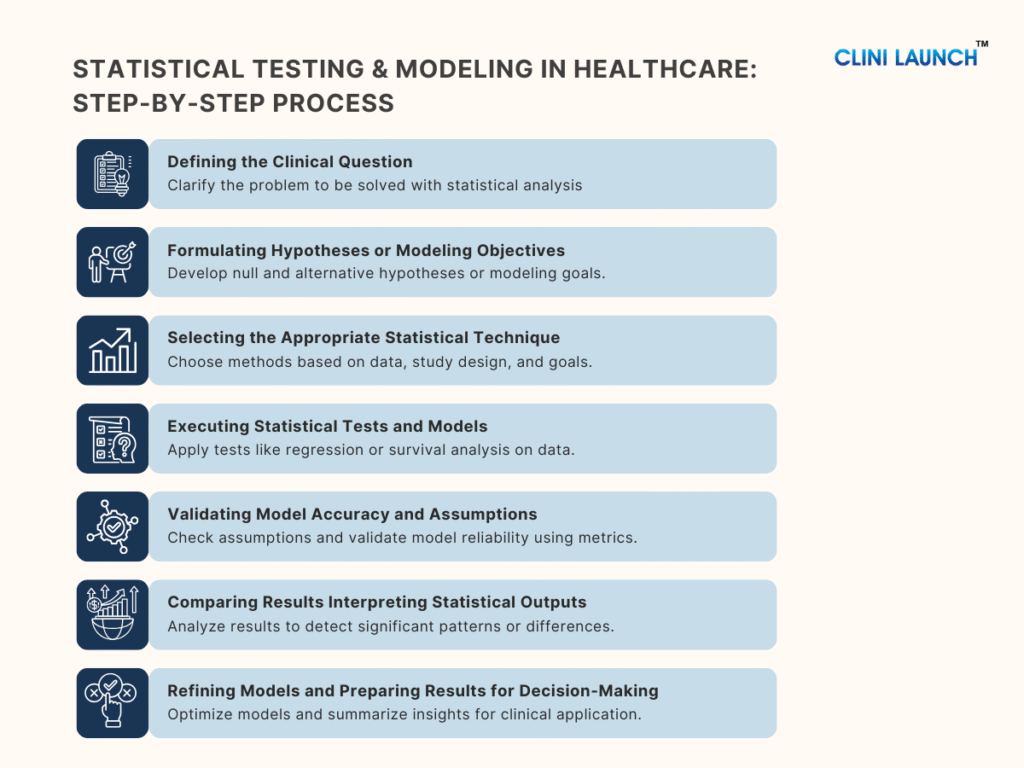
1.Defining the Clinical Question
Statistical analysts collaborate with clinicians, principal investigators, and data management teams to refine the clinical question. During this step, they collect study protocols, endpoint definitions, patient demographics, inclusion/exclusion criteria, operational workflows, and expected outcome measures to understand exactly what the analysis must answer. This ensures that the clinical question is precise, measurable, and aligned with the study’s goals.
2.Formulating Hypotheses or Modeling Objectives
Statistical analysts derive assumptions and prediction goals by reviewing the study protocol, clinical rationale, prior evidence, and predefined endpoints shared by clinical and scientific teams. They formulate hypotheses by translating these clinical expectations into a null hypothesis (no effect or no difference) and an alternative hypothesis (expected effect or difference), ensuring the outcomes are measurable and testable. We will discuss deeply about this concept in the upcoming session of the blog.
The choice of statistical methods is then guided by data type, study design, sample size, variable relationships, and regulatory standards. Objectives are finalized only after confirming that the available data can support statistically valid comparisons or predictions, ensuring alignment between clinical intent and analytical rigor.
3.Selecting the Appropriate Statistical Technique
Statistical analysts determine the right method by assessing the data type, study design, sample size, distribution, and the outcome being measured. They evaluate assumptions like normality, independence, and event frequency to ensure the technique is statistically valid. Based on these conditions, they may choose regression-based methods or survival analysis approaches when time-to-event outcomes are involved. You’ll find these techniques explained in the following sections, helping you see how each method fits into real-world healthcare analysis.
4. Executing Statistical Tests and Models
Statistical analysts first summarize each group using measures like mean, median, mode, variance, and standard deviation to understand baseline patterns. By digging into the upcoming session, you will get to know more. They then apply the chosen techniques in SAS, R, or Python—testing differences between groups or fitting regression and survival models to generate predictions. Throughout the process, they review coefficients, probabilities, and model diagnostics to ensure the results are accurate, valid, and clinically meaningful.
5. Validating Model Accuracy and Assumptions
To ensure model reliability, analysts check assumptions such as normality (data distribution), linearity (relationship type), independence (data freedom), and homoscedasticity (equal variance). They assess multicollinearity (refers to a situation where two or more predictor variables (independent variables) in a regression model are highly correlated with each other correlation) using Variance Inflation Factor (VIF) (Collinearity measure) and evaluate the model’s goodness-of-fit with metrics like R-squared (fit measure), AIC (model quality), and p-values (statistical significance). Residual analysis (error check) helps verify randomness and detect outliers, while diagnostic plots identify influential data points. Analysts also measure predictive accuracy using MSE (prediction error), RMSE (error magnitude), and ROC curves (model performance). Adjusting the model as needed to ensure it accurately represents the data for clinical decision-making.
Checklist for Validating Models:
- Assumptions: Normality (data distribution), Linearity (relationship type), Independence (data freedom), Homoscedasticity (equal variance), Multicollinearity (predictor (i.e. independent variables) correlation).
- Goodness-of-Fit: R-squared (fit measure), AIC (model quality), p-values (statistical significance).
- Residual Analysis: Randomness, Outlier detection, Influence checks.
- Accuracy Metrics: MSE (prediction error), RMSE (error magnitude), ROC curves (model performance).
6.Comparing Results Interpreting Statistical Outputs
Statistical analysts identify differences and trends by analyzing key outputs like group means, proportions, and regression coefficients using methods such as t-tests, ANOVA, or regression models. They compare these across treatment groups or variables to detect significant effects. Analysts focus on coefficients (strength and direction of relationships), probabilities (likelihood of an outcome), and p-values (statistical significance) to determine if the differences are meaningful or due to chance, guiding clinicians in data-driven decision-making.
7. Refining Models and Preparing Results for Decision-Making
Statistical analysts refine models by reviewing assumptions, checking for multicollinearity, and adjusting parameters to improve accuracy. They reduce errors by analyzing residuals and adjusting patterns, while incorporating better predictors based on clinical knowledge and exploratory analysis. Feature engineering enhances performance, and techniques like regularization help prevent overfitting. Finally, analysts ensure reliable predictions by using cross-validation, and RMSE (error magnitude), confirming that the model aligns with clinical logic and is suitable for decision-making. Once the model is optimized, they summarize and organize the key findings into clear insights, making the results accessible for clinical interpretation and informed decision-making.
5. Interpretation & Evidence Generation
This stage transforms statistical outputs into clear, actionable insights for healthcare decision-makers. Interpretation helps clinicians understand what the data means, while evidence generation supports research publications, regulatory submissions, quality improvement, and policy decisions.
Results are translated into summaries, visualizations, risk insights, and clinical recommendations. Findings are presented through dashboards, reports, and statistical summaries in a form that supports decision-making.
Applications Used for Interpretation and Evidence Generation
| Category | Applications |
|---|---|
| Visualization & Reporting Tools | Power BI, Excel |
| Programming for Clinical Insights | R, Python (plots, summaries, interpretations) |
| Regulatory-Compliant Reporting | SAS |
Effective statistical analysis in healthcare depends on a structured workflow supported by the right analytical tools. Each component of the process, from data collection to interpretation, is strengthened by specific software used across hospitals, research institutions, and clinical trials.
Types of Statistical Analysis
Before exploring complex models, it’s essential to understand the two basic ways we analyze data. These methods form the foundation of all insights—helping us explain what the data shows now and what it may reveal about the future.
Descriptive statistics focus on summarizing what is happening in the data you already have, while inferential statistics use sample data to make predictions or generalizations about a larger population. Together, they form the backbone of evidence-based decision-making in healthcare and are widely used in clinical research, public health, and hospital analytics.
Descriptive Statistics
Descriptive statistics describe and summarize data so that patterns become easy to see. In healthcare, this means turning thousands of lab results, vital signs, and patient records into clear summaries such as averages, ranges, percentages, and simple visualizations (tables, charts).
In practice, descriptive statistics work by organizing data into meaningful metrics, for example, calculating the average blood pressure in a ward, the most common diagnosis in an outpatient clinic, or the distribution of age and comorbidities in a clinical trial. These summaries help clinicians and researchers quickly understand “who” they are dealing with before testing treatments or making policy decisions.
They are heavily used to:
- Define baseline patient characteristics in clinical trials.
- Track hospital quality metrics (readmission rates, length of stay, infection rates).
- Monitor disease patterns in public health (incidence, prevalence, mortality rates).
- Build dashboards and reports that help managers and clinicians see trends over time.
The importance of descriptive statistics is growing as healthcare analytics expands. Recent market research shows that descriptive analytics still accounts for the largest share of healthcare analytics use, and the dedicated healthcare descriptive analytics segment is projected to grow from about USD 22.7 billion in 2025 to over USD 65 billion by 2030, reflecting a strong industry shift toward data-driven decision-making.
Key Statistical Indicators Used in Descriptive Statistics
Descriptive statistics rely on a set of statistical indicators that help summarize and interpret healthcare data. These indicators provide a quick overview of patient populations, treatment responses, disease patterns, or clinical trial characteristics. The most used indicators in healthcare are: Mean, Median, Mode, Variance, and Standard Deviation.
These indicators help clinicians, researchers, and data analysts understand the central tendency and variability within patient datasets, essential for making reliable, evidence-based decisions.
Mean
The mean represents the average value of a dataset. It is calculated by adding all values and dividing the number of observations. The mean is commonly used in healthcare to understand overall trends, such as average blood pressure, glucose levels, length of hospital stay, or average treatment response.
Formula:
Mean (μ) = (Σx) / N
Example:
A doctor wants to understand the overall blood sugar control of diabetic patients before starting a new medication. The total blood sugar value of 10 patients is 1,620 mg/dL.
Dividing this by 10 gives a mean of 162 mg/dL, helping the clinician assess whether the group is generally within a normal, borderline, or high glucose range before treatment. This makes the mean a practical tool for evaluating baseline patient status.
Median
The median is the middle value of a dataset when all numbers are arranged in order. It represents the central point of the data and is especially useful when extreme high or low values can distort the mean. Because healthcare datasets often contain outliers (e.g., unusually high lab results, extremely long hospital stays), the median is frequently used to report more stable and reliable central values.
Formula:
- Odd number of observations: Middle value
- Even number of observations:
Median = (Middle Value 1 + Middle Value 2) / 2
Example
Consider the following arranged blood sugar readings of 10 patients (mg/dL):
120, 130, 140, 150, 150, 160, 170, 180, 200, 220
The middle two values are 150 and 160:
Median = (150 + 160) / 2 = 155 mg/dL
Clinicians often use the median to understand the typical patient’s value when some patients have very high sugar levels due to complications. In this example, although the highest readings reach 200–220 mg/dL, the median of 155 mg/dL provides a clearer picture of the typical patient’s glycemic status before treatment. This makes the median especially effective for analyzing skewed clinical data, such as lab results, ICU stay durations, or cost of care.
Mode
The mode is the value that appears most frequently in a dataset. It is useful for identifying the most common or dominant value in a clinical measurement, especially when clinicians need to understand frequently occurring symptoms, lab results, or vital-sign patterns within a patient group.
Example :
In a group of 100 patients, the most frequently recorded blood sugar value is 150 mg/dL.
Mode = 150 mg/dL
Mode is often used when clinicians want to know the most common clinical presentation, for example, the most frequent blood sugar reading in a diabetic population, the most common blood type in a hospital, or the most frequently reported symptom in an outbreak. Knowing that 150 mg/dL is the most repeated value helps nurses and physicians recognize typical patterns and plan treatment protocols accordingly.
Standard Deviation
Standard deviation (SD) measures how much individual values deviate from the mean. In healthcare, it is critical for understanding variation in patient vitals, lab results, treatment responses, and population health trends. A high SD indicates large fluctuations, while a low SD indicates stability and consistency.
Formula:
SD (σ) = √ [(Σ (xi – x̄)²) / N]
Example :
A doctor measures systolic blood pressure for 8 patients:
118, 120, 122, 121, 119, 160, 162, 158
Most readings lie between 118–122, but three readings (158–162) are much higher, increasing the standard deviation.
Standard deviation helps clinicians understand variability within a patient group. In this example, the high SD reveals that while most patients have stable blood pressure, a subset shows dangerously high values, requiring urgent attention. This variation would not be visible if the doctor only looked at the average blood pressure, making SD essential for detecting risk and guiding intervention strategies.
Variance
Variance measures how far the values in a dataset spread out from the mean. In healthcare, it is particularly useful for understanding consistency vs. variability in patient outcomes, lab results, or treatment responses. A high variance means that patient values differ widely, while a low variance indicates that most patients show similar readings.
Formula:
Variance (σ²) = (Standard Deviation) ²
Example :
In a group of 50 patients, blood sugar levels range from 120 to 220 mg/dL. This wide range creates a high variance, showing significant differences in diabetes control.
High variance helps clinicians identify groups with unstable or poorly controlled conditions. In this case, some patients have excellent glucose control, while others are at risk of complications and need immediate intervention. Variance gives healthcare teams a deeper understanding of overall patient stability, something a simple average cannot reveal.
The descriptive statistics measures
| Measure | Meaning (Short Definition) | Formula |
|---|---|---|
| Mean | Average of all values | μ = Σx / N |
| Median | Middle value in ordered data | (For even N): (M1 + M2) / 2 |
| Mode | Most frequent value | No formula |
| Variance | How spread-out values are | σ² = Σ (x − μ) ² / N |
| Standard Deviation | How much values differ from the mean | σ = √Σ (x − μ) ² / N |
Inferential Statistics
Inferential statistics are the branch of statistics used to make conclusions, predictions, and evidence-based decisions about larger patient populations using data from a smaller sample. Unlike descriptive statistics, which only summarize what the data shows, inferential statistics help determine whether an observed effect (such as a drop in blood pressure or improvement in survival) is real or due to chance.
Inferential methods work by applying probability-based techniques such as hypothesis testing, t-tests, ANOVA, regression models, and survival analysis. These tools evaluate whether differences between treatment groups are significant, estimate risk factors, predict clinical outcomes, and assess time-to-event patterns. This is why inferential statistics are critical in areas such as clinical trials, epidemiological studies, public health research, and healthcare quality assessment, settings where decisions must be supported by scientifically valid evidence.
Inferential statistics have become even more essential in modern healthcare due to the rapid growth of clinical datasets, the adoption of AI-driven analytics, and increasing reliance on real-world evidence (RWE). According to the FDA Real-World Evidence Framework, statistical inference, it plays a key role in validating treatment effectiveness using large-scale observational data, helping accelerate regulatory decision-making.
Hypothesis testing
Hypothesis testing is a core statistical method used to determine whether a claim about healthcare data is valid — i.e. whether an observed effect (like a new treatment) is real or occurred by chance. It remains one of the most widely used tools in modern clinical research because it helps provide scientific evidence that supports or refutes treatment effectiveness, safety, or other healthcare interventions.
For example, a clinic might test a new diet plan for diabetic patients:
- Group A: Patients on an old diet.
- Group B: Patients on a new diet.
After 4 weeks, researchers compare the average blood sugar levels of both groups.
| Type | Statement |
|---|---|
| Null Hypothesis (H₀) | The new diet does not reduce blood sugar as much as the old diet. |
| Alternate Hypothesis (H₁) | The new diet does reduce blood sugar more than the old diet. |
A statistical test (e.g. a t-test) then checks whether the observed difference (say, 15 mg/dL) is large enough to be unlikely due to random variation. If the result yields a p-value of 0.03, there is only a 3% chance that such a difference would arise by chance — suggesting the new diet likely has a true effect.
Why Hypothesis Testing is More Important Than Ever in Healthcare
- Evidence-based medicine & regulatory approval:
Clinical trials, drug approvals, and treatment guidelines all rely on hypothesis testing to validate efficacy and safety before therapies reach patients. Regulatory bodies worldwide accept results based on properly conducted hypothesis tests.
- Large and complex datasets:
With growth in real-world data (EHRs, genomics, wearables, registry data), hypothesis testing helps distinguish true effects from random noise — especially in observational studies and post-market surveillance.
- Comparative effectiveness & personalized medicine:
As healthcare shifts towards personalized treatment, hypothesis testing helps compare multiple treatments, subgroups, or biomarkers to identify which works best for whom.
- Public health decisions:
In epidemiology, for vaccine effectiveness, disease outbreaks, population health studies — hypothesis testing validates trends and informs policy.
Regression Analysis
Regression analysis is a statistical method used to examine how one or more variables influence an outcome. In healthcare, it is widely used to predict patient outcomes, identify clinical risk factors, and understand which variables have the strongest impact on health status. It helps clinicians and researchers quantify relationships—such as how age, lifestyle, or clinical biomarkers affect disease progression or treatment response.
Today, regression models are becoming even more essential due to the rise of EHR-driven analytics, precision medicine, and early-risk prediction tools. Hospitals increasingly use regression-based models to predict readmission risk, sepsis likelihood, treatment response, and disease severity.
Example:
Once researchers confirm that a lifestyle or treatment program is effective, the next step is to understand why it works, and which factors contribute most to improvement. They collect data from patients on variables such as:
- Age
- BMI
- Daily exercise minutes
- Diet adherence score
- Stress levels
- Sleep hours
- Baseline blood sugar levels
Using regression analysis, they determine how strongly each variable influences the outcome (e.g., reduction in blood sugar levels). This helps clinicians identify which factors drive improvement the most and personalize care plans accordingly.
Linear Regression
Linear regression is a statistical technique used to understand how an outcome (such as blood glucose, blood pressure, or cholesterol levels) changes based on one or more influencing factors. In healthcare, it is widely used for predicting continuous outcomes, evaluating how lifestyle or clinical factors affect patient results, and identifying which variables have the strongest impact on treatment response.
Linear regression is becoming increasingly important due to the rise of precision medicine and predictive analytics, where clinicians rely on data-driven models to anticipate disease progression or treatment effects.
Example question:
“How much does a patient’s blood sugar decrease for every 10 extra minutes of daily exercise?”
This helps healthcare teams quantify relationships and design more personalized interventions.
Logistic Regression
Logistic regression is used to predict the probability of an event — such as recovery, complications, readmission, or treatment of success. Instead of predicting a numeric value, it predicts outcomes like Yes/No, Success/Failure, or Disease/No Disease. This makes it essential for clinical decision-making, risk scoring, and medical diagnosis tools.
It has gained major relevance in recent years due to its use in risk prediction models, such as identifying high-risk cardiac patients, predicting ICU admissions, or assessing the likelihood of disease onset.
Example question:
“What is the probability that a patient’s blood sugar will return to normal after 8 weeks?”
This helps clinicians estimate risk, guide to treatment planning, and personalize care pathways.
Survival Analysis
Survival analysis is a statistical approach used to evaluate how long it takes for an event to occur, such as recovery, relapse, hospitalization, or death. In healthcare, it is crucial for time-to-event analysis in clinical trials, oncology studies, chronic disease monitoring, and treatment comparison.
This method is increasingly important as modern clinical trials, and real-world evidence studies require precise time-based evaluation of treatment effectiveness and patient outcomes.
Example questions:
- “How long do blood sugar improvements last after a lifestyle program?”
- “When do glucose levels begin to rise again?”
- “Do patients receiving the new treatment remain stable longer?”
Inferential statistics measures
| Method | Simple Meaning | Purpose | Formula (Basic) |
|---|---|---|---|
| Hypothesis Testing | Checks if differences are real or by chance | Compare two groups/treatments | t-test: t = (x̄₁ − x̄₂) / SE |
| Regression Analysis | Finds relationships between variables | Predict outcomes & risk | Linear: ŷ = a + bX Logistic: p = 1 / (1 + e⁻(a+bX)) |
| Survival Analysis | Measures time until an event occurs | Estimate survival or recovery time | Kaplan–Meier: S(t) = Π (1 − d/n) |
Real World Applications of Statistical Analysis in Healthcare
Descriptive Statistics in a Clinical Trial
During the COVID-19 pandemic, researchers faced an urgent challenge: understanding which patients were eligible for treatment trials and how disease severity varied across the population. The RECOVERY TRIAL, one of the world’s largest COVID-19 clinical trials, needed a structured way to analyze thousands of incoming patient records that differed widely in age, comorbidities, vitals, and severity levels.
How descriptive statistics helped:
Researchers summarized key baseline characteristics such as mean age, median oxygen saturation, most common comorbidities, and the overall distribution of disease severity. These descriptive summaries allowed the team to clearly define and refine inclusion and exclusion criteria.
Outcome:
Through this process, the team determined that 14,892 of 22,560 patients (66%) met the eligibility requirements—ensuring the study population was balanced, representative, and scientifically valid.
Descriptive statistics turned scattered raw data into organized, interpretable insight, forming the foundation upon which the entire clinical trial was built.
Inferential Statistics in a Clinical Trial
After defining the patient’s groups, the next challenge was determining whether a treatment actually produced meaningful clinical benefit. In the RECOVERY Trial’s aspirin arm, researchers compared two groups:
- One received aspirin
- The other received standard care
Although both groups showed 17% mortality after 28 days, inferential statistics were required to test whether this similarity reflected reality or was due to random variation.
Challenge:
Could aspirin reduce mortality in hospitalized COVID-19 patients?
How the study was conducted:
Researchers applied inferential statistical tools—hypothesis testing, p-values, confidence intervals, and risk ratios—to determine whether any observed difference between groups was statistically significant.
Result:
The analysis yielded a non-significant p-value, confirming that aspirin did not reduce 28-day mortality.
Based on this evidence, aspirin was not recommended as a therapeutic option for reducing mortality in COVID-19 hospitalizations. The study helped redirect global clinical guidance toward more effective interventions.
Conclusion
Statistics shifts healthcare from relying solely on intuition to functioning as an evidence-driven science. Whether defining normal physiological ranges, assessing treatment outcomes, or monitoring health trends, Statistical Analysis in Healthcare forms the backbone of modern medical research and decisions.
If this blog helped you see the value of statistical analysis, you can take the next step by building these skills properly through ours Biostatistics course. It’s designed for students who want clear, practical learning, and real healthcare examples.
Strengthen your statistical foundation today and prepare yourself for a future where healthcare decisions are powered by data.