
Introduction
Survival analysis is a statistical method used to analyze the time until a specific event occurs. This event could be anything from the death of a patient, the recurrence of a disease, recovery from an illness, or even the failure of a machine. In clinical studies, survival analysis is commonly used to evaluate the effectiveness of treatments by studying patient survival rates.
Originally, survival analysis focused on studying cancer patients’ time from treatment until death. However, it has since expanded to various other fields. This method is valuable because it not only looks at whether an event happens but also considers when it occurs, making it more insightful than simply counting events.
Survival analysis plays a crucial role in biostatistics, as it helps researchers understand disease progression, treatment effectiveness, and other factors affecting patient health. This field continues to evolve with new statistical techniques and data integration methods that improve accuracy and efficiency.
Enroll For: Biostatistics Course
Understanding Censoring in Survival Analysis

Censoring occurs when we do not have complete information about a subject’s survival time. This happens when a study participant drops out before the study ends or when the event of interest has not occurred before the study concludes.
Censoring can introduce bias if not properly handled. It is classified into three types:
- Right censoring: When the event occurs after the last observation.
- Left censoring: When the event happened before the study began, but the exact time is unknown.
- Interval censoring: When the event time is known to lie within a certain time range.
For survival analysis to be valid, censoring should be non-informative, meaning that the reason for censoring should not be related to the event of interest. If censoring is informative (for example, if patients drop out because they are getting sicker), it can lead to biased results. Several statistical methods, such as imputation techniques, sensitivity analysis, and defining drop-out as an outcome, help in addressing these challenges.
Read our Blog post on: Emerging Trends and Techniques in Structural Bioinformatics| 2025
Survivor and Hazard Functions
The hazard function plays a key role in predicting risk over time, making it central to many survival models. The shape of the hazard function provides insights into disease progression, treatment efficacy, and patient outcomes. A decreasing hazard function suggests an initial high risk that diminishes over time, while an increasing hazard function may indicate worsening conditions. Researchers use these functions to model survival probabilities accurately, helping guide clinical decision-making and policy development.
- Survivor function S(t): Represents the probability of surviving beyond a specific time t.
- At time 0, S(0) = 1, since everyone starts alive or event-free.
- As time increases, S(t) decreases towards 0 as events occur.
- Hazard function (h(t)): Describes the rate at which events occur at any given time, provided the subject has survived up to that point.
- It has units of 1/time.
- The hazard rate varies over time, depending on the condition being studied.
The hazard function is central to survival analysis, helping researchers understand risk accumulation and estimate survival probabilities more accurately.
Applications of Survival Analysis
Survival analysis is widely used across different fields:
- Medical research: Examining patient survival rates after treatments like chemotherapy.
- Engineering: Predicting the lifespan of machine parts.
- Finance: Assessing loan default risks.
With advancements in biostatistics and data integration methods, survival analysis continues to be a powerful tool for decision-making in various industries.
Key Techniques in Survival Analysis
Survival analysis uses different statistical methods, which can be classified as parametric, semi-parametric, and non-parametric. Some of the most common techniques include:
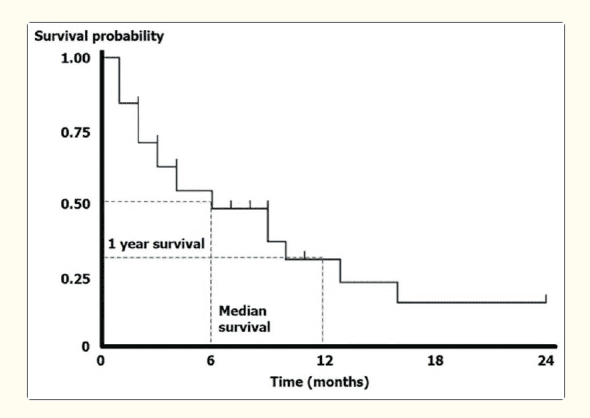
1. Kaplan-Meier (KM) Method

- A non-parametric approach used to estimate the survival function.
- It provides a survival curve showing the probability of survival over time.
- Unlike traditional life tables, it calculates survival probabilities at each event time rather than fixed intervals.
Source: 10.4103/ijd.IJD_201_17
2. Log-Rank Test
- Used to compare survival times between two or more groups.
- Tests the hypothesis that groups experience the same hazard rates over time.
3. Cox Proportional Hazards Model
- A semi-parametric model that evaluates the impact of different variables on survival.
- Assumes the hazard ratio remains constant over time.
Other advanced methods include:
- Life table analysis: Uses life tables to estimate survival probabilities.
- Parametric survival models: Assume specific distributions (e.g., exponential, Weibull) for survival times.
- Time-dependent covariates: Allow factors that change over time to be included in the Cox model.
The log-rank test is a nonparametric hypothesis test to compare the survival trend of two or more groups when there are censored observations. It is widely used in clinical trials to compare the effectiveness of interventions when the outcome is time to an event
Comparing Survival Times Between Groups

The log-rank test is the most widely used method to compare survival curves from different groups.
How to perform a log-rank test:
- Generate Kaplan-Meier survival curves for each group.
- Use statistical software to calculate the test statistic and p-value.
- Interpret the results—if the p-value is significant, survival times differ between groups.
Other measures include:
- Median survival time: Time at which 50% of participants have experienced the event.
- Hazard ratio: Compares the event risk in different groups.
- Handling censored data: Ensuring proper adjustments for missing survival times.
Challenges in Survival Analysis
Survival analysis presents several challenges, which includes:
- Data integration challenges: Combining data from different sources requires standardization and consistency.
- Censoring issues: Proper handling of censored data is crucial to avoid bias.
- Model assumptions: Some models require assumptions about hazard rates, which may not always hold true.
- How to implement statistical process control: Ensuring quality control in data collection and analysis is essential.
Statistical process control techniques help monitor data quality, and obtaining a statistical process control certification ensures best practices are followed in research studies.
Enroll For: Biostatistics Course
Conclusion
Survival analysis is a fundamental tool in biostatistics, particularly in medical research. It helps answer crucial questions about when and why certain events occur. By considering both the occurrence and timing of events, survival analysis provides deeper insights than simple event counting.
With various statistical techniques like Kaplan-Meier estimation, the Cox model, and the log-rank test, researchers can effectively analyze survival data while addressing challenges like censoring and data integration. Understanding survival analysis is essential for anyone working in clinical research, public health, or any field dealing with time-to-event data.
As data science evolves, survival analysis will continue to benefit from new computational methods and data integration strategies, making it even more powerful for researchers and decision-makers alike.
Frequently Asked Question (FAQ’s)
1. What is survival analysis?
Survival analysis is a set of statistical techniques used to analyze data where the primary outcome of interest is the time until a specific event occurs.
2. What are the common techniques used in survival analysis?
Survival analysis commonly utilizes methods such as Kaplan-Meier (KM) plots, log-rank tests, and Cox proportional hazards regression. While these are widely used in cancer research, other advanced techniques are also valuable and should be considered.
3. What makes survival analysis unique?
A distinctive feature of survival data is the presence of censoring, where some individuals do not experience the event (e.g., death) by the end of the study period. This means that their exact survival time is unknown and must be accounted for in the analysis to ensure accurate conclusions.
4. What is the most used model in survival analysis?
The Cox proportional hazards model is the most widely used survival regression model. It analyzes the relationship between predictor variables and the time-to-event through the hazard function, making it essential for survival analysis.
5. What is Kaplan-Meier analysis?
The Kaplan-Meier method is a statistical approach for estimating survival probabilities over time. It accounts for censoring by considering individuals who have not yet experienced the event and assumes their survival duration follows the same pattern as those who have already experienced the event.
6. What is the primary objective of survival analysis?
The main goal of survival analysis is to estimate and understand the relationship between the time-to-event (response variable) and one or more predictor variables, helping researchers make informed conclusions.
7. How is survival analysis performed using R?
Survival analysis in R enables researchers to examine the occurrence rates of events over time without assuming constant event rates. It allows for modeling the time until an event, comparing time-to-event across different groups, and assessing correlations between time-to-event and various quantitative variables.


Nice blog good information for clinical research, “Survival Analysis in Biostatistics” explores key techniques for analyzing time-to-event data, essential for clinical research and healthcare insights.
Mitolyn I just like the helpful information you provide in your articles
Glad you find our blogs helpful. stay tune for more such informative blogs!