Biostatistics in Clinical Research
Biostatistics in clinical research uses tools such as SAS, R, Python, SQL, and CDISC standards to analyze clinical trial data and support regulatory submissions.
In today’s healthcare landscape, clinical trials, hospital systems, and public health research generate massive volumes of healthcare data that require accurate statistical interpretation. This growing dependence on clinical biostatistics has made biostatistics tools essential for clinical trial data analysis, healthcare analytics, and evidence-based medical research.
Biostatisticians use specialized tools for statistical modeling, data validation, reporting, and regulatory documentation to transform complex clinical data into meaningful insights. From analyzing treatment outcomes to supporting regulatory submissions, these tools play a critical role in modern healthcare research workflows.
In this blog, we explore the most important biostatistics tools used in clinical research and healthcare analytics, along with their real-world applications in the industry. Professionals looking to build practical expertise in these areas often pursue specialized training such as the Advanced Diploma in Biostatistics offered by CliniLaunch Research Institute.
Who is a Biostatistician?
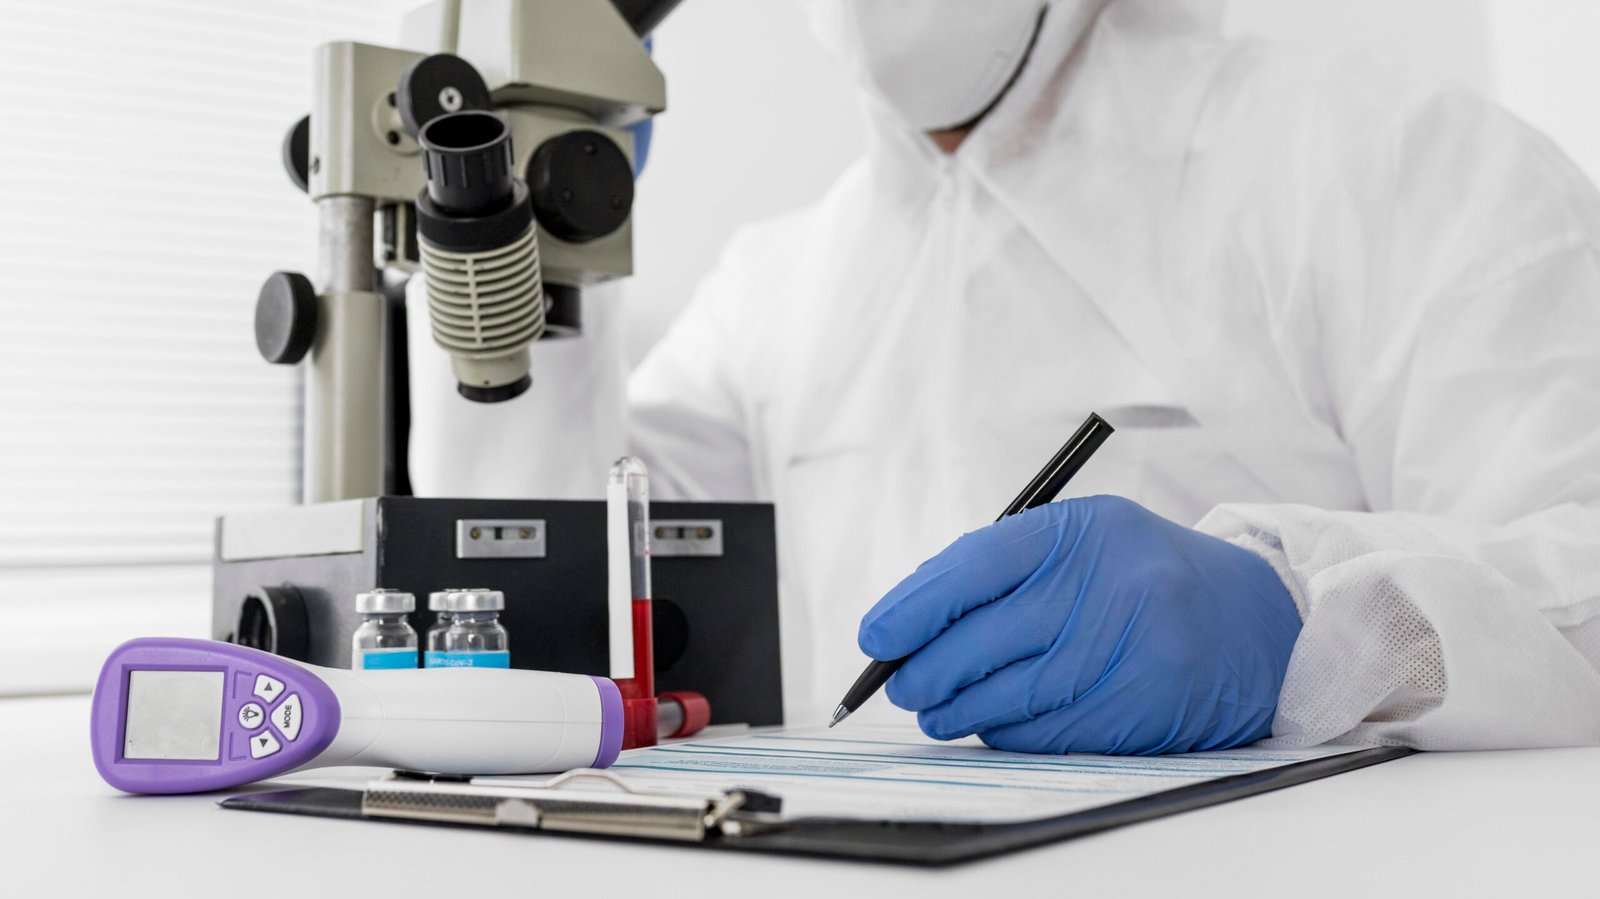
A clinical biostatistician plays a critical role in analyzing healthcare data and supporting clinical trial decisions. A biostatistician applies statistical methods to clinical research, public health, and healthcare datasets to generate scientifically valid insights that support evidence-based medical decisions.
The biostatistician job involves working closely with researchers, clinicians, and regulatory teams to ensure data accuracy, study validity, and reliable interpretation of clinical outcomes. To succeed in this field, professionals require important biostatistician skills such as statistical analysis, data interpretation, programming knowledge, and understanding of clinical research workflows.
Key responsibilities include:
- Designing statistical plans for clinical trials
- Analyzing healthcare and clinical research data
- Interpreting results for evidence-based decisions
- Ensuring data quality and regulatory compliance
- Supporting clinical study reporting and submissions
The demand for clinical biostatisticians continues to grow across pharmaceutical companies, CROs, and healthcare research organizations.
Why Biostatistics Tools Are Critical in Healthcare Research
Biostatistics tools help transform complex healthcare datasets into reliable scientific insights. Clinical trials and public health studies generate large volumes of data that require accurate statistical analysis, structured reporting, and regulatory-compliant outputs. Tools such as SAS, R, Python, and SQL allow biostatisticians to analyze data efficiently, apply statistical models, and support evidence-based medical decisions.
- Skills Required to Master Biostatistics Tools:
To use biostatistics tools effectively, professionals need a combination of statistical knowledge, programming ability, and understanding of clinical research data. Important skills include statistical modeling, programming in SAS or R, database querying with SQL, data cleaning, and interpreting analytical results accurately. Strong foundations in clinical biostatistics are essential for working with healthcare datasets.
- Why Upskilling in Biostatistics Tools Matters:
As healthcare research becomes more data-driven, the demand for professionals who can analyze clinical datasets is increasing. Learning industry-relevant tools such as SAS, R, and SQL helps professionals move beyond theoretical knowledge and develop practical analytical skills required in clinical research and healthcare analytics.
- Career Roles and Opportunities After Mastering Biostatistics Tools:
Professionals who master biostatistics tools can pursue roles such as Biostatistician, Clinical SAS Programmer, Statistical Programmer, Healthcare Data Analyst, Epidemiology Analyst, or Real-World Evidence (RWE) Analyst. These roles exist in pharmaceutical companies, Contract Research Organizations (CROs), biotechnology firms, and healthcare research institutions.
To perform these responsibilities effectively, biostatisticians rely on a wide range of analytical, statistical, and reporting tools. These tools help them manage large datasets, apply statistical models, ensure regulatory compliance, and communicate findings clearly.
Understanding biostatistics in clinical research is essential because it ensures that clinical trial data is accurate, reliable, and suitable for regulatory decision-making. Role of Biostatistics in Clinical Research.
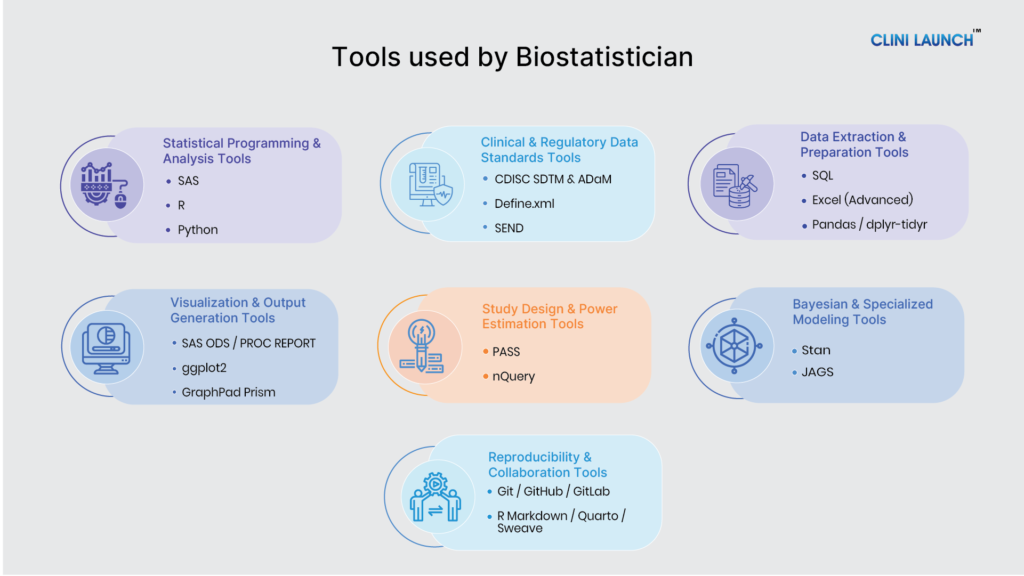
Top 20 Tools Used by Biostatistician
The tools below represent the core technologies used by biostatisticians in clinical research, public health studies, and healthcare data analysis. A strong understanding of biostatistics tools helps professionals manage, analyze, and interpret clinical data efficiently.
A) Basic Biostatistics Tools Used in Healthcare Research
Basic tools form the foundation of biostatistical work and are widely used for statistical analysis, data preparation, and reporting.
1. SAS (Statistical Analysis System): SAS (Statistical Analysis System) is an industry-standard statistical software widely used in clinical research and biostatistics. It is known for its reliability, regulatory acceptance, and ability to handle large and complex clinical trial datasets.
Biostatisticians use SAS extensively for clinical trial data analysis across different study phases. It plays a critical role in creating CDISC-compliant datasets such as SDTM and ADaM, which are mandatory for regulatory submissions. SAS is also used to generate tables, listings, and figures (TLFs) that form the backbone of clinical study reports submitted to global regulatory authorities like the FDA and EMA.
Learning SAS involves understanding clinical data structures, building programming logic, and producing accurate statistical outputs that meet regulatory standards. SAS is widely used for biostatistics in clinical trials, especially for regulatory submissions.
2. R Programming: R is an open-source statistical programming language widely used in biostatistics, public health, and healthcare research. It is especially valued for its flexibility, strong statistical capabilities, and extensive ecosystem of specialized packages.
Biostatisticians use R for advanced statistical modeling, including regression analysis, survival analysis, and longitudinal data analysis. It is also one of the most powerful tools for data visualization, allowing biostatisticians to create clear and publication-quality graphs that help clinicians, researchers, and stakeholders interpret complex results. Because R is open-source, it serves as a cost-effective alternative to proprietary software, making it highly attractive for research and analytics-driven environments. Learning R involves understanding data structures, performing statistical analysis, and creating reproducible visualizations.
3. Python Programming: Python is a versatile, open-source programming language that has become increasingly important in biostatistics and healthcare data analysis. While not traditionally a biostatistics-only tool, Python is widely used today for handling large datasets, automating workflows, and integrating statistical analysis with modern data science techniques.
Biostatisticians use Python primarily for data cleaning, preprocessing, and exploratory data analysis. Its rich ecosystem of libraries such as Pandas, NumPy, SciPy, and Statsmodels allows efficient handling of complex healthcare and clinical datasets. Python is also used to automate repetitive analytical tasks, making workflows faster and more reliable, especially in large-scale studies. Learning Python for biostatistics focuses on data manipulation, statistical analysis of libraries, and building reproducible analytical workflows.
4. Stata: Stata is a statistical software package widely used in epidemiology, public health, and health economics. It is especially known for its strong support for longitudinal data analysis, survival analysis, and complex survey data management.
Biostatisticians use Stata for analyzing cohort studies, population-based studies, and time-to-event data. Its built-in commands for panel data, survival models, and survey-weighted analysis make it particularly useful for public health research and large observational datasets. It is less common in regulated pharmaceutical clinical trial submissions but remains highly relevant in non-regulatory research settings.
Learning Stata typically involves understanding its command syntax, mastering data management workflows, and applying appropriate statistical models. Understanding do-files and interpreting outputs is essential for reliable results.
5. SQL: SQL (Structured Query Language) is a standardized language used to retrieve, manage, and manipulate data stored in relational databases. It allows users to query large volumes of structured information efficiently and extract precisely the subsets required for analysis.
Biostatisticians use SQL to pull clinical and research data from operational systems, verify records, perform joins across multiple tables, and prepare datasets before they enter statistical software. It is particularly valuable when working with large repositories where manual handling is impractical. Learning SQL involves understanding database structures and writing efficient queries for accurate data extraction.
6. Microsoft Excel: Microsoft Excel is a widely used spreadsheet application that plays an important supporting role in biostatistics and healthcare data work. Although it is not a primary statistical engine, it is extremely valuable for organizing datasets, performing quick reviews, and interacting with structured information in a visual and intuitive way.
Biostatisticians commonly use Excel for data checks, reconciliations, cross-verification of outputs, and exploratory summaries. Features such as filtering, pivot tables, formulas, and lookups make it easier to identify inconsistencies, compare datasets, and validate results generated from programming environments. It often acts as a bridge between raw data sources and formal statistical analysis, particularly during quality control and review stages. Learning Excel for biostatistics focuses on pivot tables, advanced formulas, and data validation techniques.
7. dplyr / tidyr: dplyr and tidyr are widely used packages within the R ecosystem that focus on transforming, reshaping, and organizing data into formats suitable for analysis. They provide clear, readable functions that allow users to filter records, create new variables, summarize information, and convert datasets between wide and long structures.
Biostatisticians rely on these tools to prepare analysis-ready data efficiently and reproducibly. They make it easier to implement consistent cleaning rules, manage complex joins, and standardize derivations across projects. Because the syntax is expressive and pipeline-driven, workflows are easier to audit, review, and rerun.
These packages are commonly used in academic research, epidemiology, public health analytics, and increasingly in pharmaceutical and CRO environments that incorporate R into their statistical processes.
8. ggplot2 within R: ggplot2 is a powerful data visualization package built on the grammar of graphics, enabling structured and highly customizable statistical plots. It allows users to layer data, aesthetics, and geometric elements in a systematic way, making complex visual communication both flexible and precise.
Biostatisticians use ggplot2 to create clear exploratory graphics, publication-quality figures, and analytical visualizations that help interpret trends, distributions, and treatment effects. Its programmatic approach supports reproducibility and makes it easier to apply consistent styling across studies. It is especially valued where transparency, customization, and integration with analytical code are priorities. Learning ggplot2 involves mapping data to visual elements and creating clear statistical graphics.
9. GraphPad Prism: GraphPad Prism is a statistical analysis and graphing software widely used in biomedical and life science research. It is especially popular among biostatisticians, biologists, and laboratory researchers for its ability to combine basic statistical analysis with high-quality data visualization.
Biostatisticians use GraphPad Prism for conducting common statistical tests such as t-tests, ANOVA, nonparametric tests, and survival analysis, particularly in preclinical, laboratory, and experimental research. It is also valued for creating publication-quality graphs that are easy to interpret and suitable for scientific papers and presentations. It is not designed for large-scale clinical trial data analysis but is well suited for smaller datasets and experimental studies. Learning GraphPad Prism focuses on selecting appropriate statistical tests and creating clear scientific graphs.
B) Advanced Statistical Tools Used by Biostatisticians
Advanced tools support complex statistical modeling, regulatory submissions, and large research datasets. These tools support advanced study design, regulatory documentation, and specialized statistical methods.
10. SAS ODS / PROC REPORT: SAS ODS (Output Delivery System) and PROC REPORT are core components within SAS that are used to transform statistical results into structured, presentation-ready outputs. They allow programmers to format tables, control layouts, apply titles and footnotes, and generate consistent displays across different formats such as PDF, RTF, or HTML.
Biostatisticians rely on these tools to produce tables, listings, and figures that summarize study data in a clear and standardized way. Because outputs must often be reviewed, replicated, and compared across analyses, ODS and PROC REPORT provide the control and repeatability required for dependable reporting.
These capabilities are widely used in pharmaceutical research, CRO environments, and other clinical settings where formal documentation and high levels of accuracy are essential. They are central to preparing materials that later become part of study reports or regulatory packages.
Learning ODS and PROC REPORT usually involves understanding dataset structures, mastering formatting options, and practicing how to translate statistical results into reviewer-friendly layouts. With experience, users focus on automation, template consistency, and minimizing manual intervention to improve reliability.
11. PASS: PASS is a specialized statistical application designed for power analysis and sample size determination. It provides validated procedures for a wide variety of study designs, endpoints, and hypothesis-testing frameworks, helping researchers plan investigations with appropriate statistical strength.
Biostatisticians use PASS to estimate how many participants or observations are required to detect meaningful effects while controlling error rates. The software supports comparisons of alternative design assumptions, enabling teams to balance feasibility, cost, and scientific rigor before a study begins.
PASS is widely applied in clinical research, pharmaceutical development, academic investigations, and public health projects where formal justification of study size is required in protocols or funding submissions.
Learning PASS typically involves understanding key statistical concepts such as effect size, variance, significance levels, and power. As experience develops, users focus on interpreting scenarios, documenting assumptions, and communicating design rationale clearly to multidisciplinary teams.
12. nQuery: nQuery is a dedicated statistical tool used for determining sample size and evaluating power across a wide range of clinical and research study designs. It offers extensive methodologies that help teams assess how different assumptions influence the likelihood of detecting treatment effects.
Biostatisticians use nQuery to justify enrollment targets, explore alternative design strategies, and ensure that planned analyses will meet scientific and regulatory expectations. The software supports complex scenarios, including adaptive approaches and survival endpoints, making it valuable during protocol development.
nQuery is commonly used in pharmaceutical organizations, CROs, academic trials, and publicly funded research where defensible design calculations are essential components of study documentation.
Learning nQuery generally starts with building a strong understanding of statistical testing principles, effect sizes, and variability inputs. With practice, users gain confidence in scenario evaluation, sensitivity analysis, and clear communication of the assumptions underlying sample size decisions.
13. G*Power: G*Power is a standalone application created to help researchers perform statistical power and sample size calculations through an accessible, menu-driven environment. It is designed to make planning computations available even to users who may not work inside large enterprise statistical systems.
Biostatisticians often turn to G*Power when rapid estimations are needed for standard hypothesis tests or when supporting exploratory or educational research activities. Its structure allows quick comparison of input parameters and immediate visualization of how design choices influence feasibility.
The software is especially prevalent in universities, thesis projects, investigator-initiated studies, and early research settings where simplicity and speed are priorities.
14. Define.xml: Define.xml is a standardized metadata document used in clinical research to describe the structure, content, and derivation of submitted datasets. Rather than containing patient data itself, it explains how variables are defined, how values are calculated, and how analysis results relate back to the originally collected information.
Biostatisticians use Define.xml to ensure clarity, transparency, and traceability in their analyses. It helps reviewers understand dataset structures, controlled terminology, computational methods, and the lineage between raw data and statistical outputs. By documenting these relationships, it supports reproducibility and consistent interpretation.
Define.xml is routinely included in submission packages prepared under standards from the Clinical Data Interchange Standards Consortium. It is examined by regulatory authorities such as the U.S. Food and Drug Administration and is widely expected across pharmaceutical companies and Contract Research Organizations working in regulated environments.
Learning Define.xml usually starts with understanding metadata concepts, variable attributes, value-level definitions, and derivation rules. Familiarity with SDTM and ADaM structures, along with practice in mapping analysis outputs back to source data, helps build the operational confidence required in real submissions.
15. SEND: SEND (Standard for Exchange of Nonclinical Data) is a data standard used to organize and describe information from preclinical and toxicology studies. It provides a consistent structure for representing animal study data so that results can be reviewed, compared, and interpreted efficiently.
Biostatisticians use SEND when analyses involve nonclinical experiments that support the safety evaluation of new therapies. The model helps ensure that variables, terminology, and dataset relationships are clearly defined, enabling traceability from collected observations to statistical summaries.
SEND is implemented under the framework developed by the Clinical Data Interchange Standards Consortium and is required for certain submissions reviewed by authorities such as the U.S. Food and Drug Administration. It is commonly applied in pharmaceutical research organizations, toxicology groups, and CROs involved in preclinical development.
Learning SEND typically begins with understanding domain structures, controlled terminology, and how laboratory and pathology data are represented within standardized datasets. Working with sample mappings from raw study outputs into SEND formats helps develop the familiarity needed for regulatory-ready documentation.
16. Stan: Stan is a modern platform for statistical modeling that focuses on efficient computation for complex probabilistic systems. It is built around advanced sampling algorithms such as Hamiltonian Monte Carlo, which allow faster and more stable estimation in high-dimensional problems.
Biostatisticians choose Stan when models demand computational performance, scalability, and flexibility beyond classical Gibbs-sampling frameworks. It is especially strong for hierarchical structures, continuous parameter spaces, and situations where precise estimation and diagnostics are critical. Stan is widely integrated into research workflows through interfaces with programming environments, enabling seamless combination of modeling, simulation, and post-processing within broader analytical pipelines.
Learning Stan typically involves understanding model specifications in its dedicated language, defining parameters and priors, and interpreting convergence diagnostics to ensure reliable inference.
17. BUGS / OpenBUGS / WinBUGS: The BUGS family of software (Bayesian inference Using Gibbs Sampling) represents one of the earliest widely adopted systems for practical Bayesian computation. It introduced a structured way to describe probabilistic models and automatically perform sampling through iterative simulation.
WinBUGS was the original Windows-based implementation and became widely known through academic publications and early applied research. OpenBUGS later emerged as an open-source continuation, extending accessibility and enabling community-driven updates while maintaining compatibility with established model syntax.
Biostatisticians often encounter BUGS in legacy projects, published literature, and long-standing academic workflows. Many foundational teaching materials and historical trial methodologies were developed using this framework, making it important for understanding how Bayesian practice evolved.
These tools are commonly seen in universities and methodological research units where continuity with earlier work and compatibility with existing scripts are required.
Learning BUGS generally centers on writing model scripts, specifying distributions, and interpreting posterior summaries produced through repeated sampling iterations.
18. JAGS: JAGS (Just Another Gibbs Sampler) is a system developed to provide a flexible and extensible alternative compatible with the BUGS modeling style. It allows users to run Bayesian analyses while benefiting from improved modularity and easier integration with external statistical environments.
Biostatisticians often prefer JAGS when they want the familiarity of BUGS syntax but need greater adaptability, updated maintenance, or smoother connections with modern workflows. JAGS appears frequently in academic collaborations, simulation studies, and applied research where scripted execution and customization are important.
Learning JAGS involves defining models, preparing data inputs, managing simulation settings, and extracting posterior estimates for interpretation and reporting.
C) AI-Driven and Modern Tools Used in Biostatistics
Modern biostatistics increasingly rely on tools that support reproducible research, automated reporting, and integration with artificial intelligence workflows. These tools improve collaboration, transparency, and efficiency in data-driven healthcare research. AI is transforming biostatistics into clinical trials by improving efficiency and predictive modeling.
19. Git / GitHub / GitLab: Git is a distributed version control system that allows biostatisticians to track changes in code, manage project versions, and collaborate effectively with other team members. GitHub and GitLab are web-based platforms built on Git that provide repository hosting, team collaboration, issue tracking, and project management features.
Biostatisticians use these tools to maintain a full history of analysis of scripts, coordinate work among multiple contributors, and ensure that workflows are auditable and reproducible. They are especially important in multi-person projects, regulatory submissions, and environments where traceability and transparency are required.
Learning Git and its associated platforms typically involves understanding version tracking, branching, merging, and collaborative workflows, as well as practicing repository management and resolving conflicts, which ensures that code is efficiently organized and analyses remain reproducible.
20. R Markdown / Quarto / Sweave: R Markdown, Quarto, and Sweave are dynamic reporting frameworks within the R ecosystem that allow biostatisticians to combine statistical code, outputs, and narrative text into a single reproducible document. These tools enable analysts to produce automated reports, tables, figures, and summaries that update seamlessly when underlying data or analyses of change.
Biostatisticians use these frameworks to create transparent, reproducible documents that integrate methodology, results, and commentary. This approach improves collaboration, facilitates peer review, and ensures that analyses can be rerun consistently, which is critical for regulatory submissions, publications, and internal reporting.
Learning R Markdown, Quarto, or Sweave involves understanding document structure, embedding and executing code chunks, formatting outputs, and integrating text with statistical results. Developing these skills ensures that reports are accurate, reproducible, and professionally presented.
Learning industry-relevant biostatistics tools is essential for building a successful career in healthcare analytics.
Clinical SAS
Build practical skills in clinical data analysis and reporting using SAS, aligned with regulatory standards used in clinical trials. Learn how clinical trial data is cleaned, analyzed, and presented for regulatory submissions and study reporting.
How Artificial Intelligence is Transforming Biostatistics
1. AI Enhances Data Workflows
Artificial intelligence is increasingly used in biostatistics to automate tasks such as data validation, anomaly detection, and data processing. For example, industry discussions and recent clinical programming trends show AI assisting in tasks such as sample size estimation and data processing, while human experts remain responsible for oversight and validation.
2. AI Improves Efficiency Across the Clinical Trial Life Cycle
AI is transforming how clinical trials operate by enabling predictive analytics for trial design, enhancing patient recruitment, optimizing site selection, and accelerating data cleaning and reporting. Studies show AI can improve trial timeline performance and reduce operational costs, highlighting how AI tools will continue to complement biostatistics work by enabling more efficient processes.
3. Biostatisticians Will Focus More on Interpretation
Rather than replacing biostatisticians; AI shifts their role toward strategic decision-making and interpretation of complex outputs. Reports on the evolving role of statistical programming show professionals increasingly need fluency in open-source languages like R and Python, as well as familiarity with AI tools that assist with data tasks, prediction modeling, and reproducibility.
4. Real Use Cases Exist Where AI Is Accepted in Trials
Concrete evidence of AI’s growing role includes regulatory acceptance of AI tools like AIM-NASH in clinical research, where machine learning models are used in liver disease trials to produce scientifically valid outputs that regulators consider reliable.
As healthcare research becomes increasingly data-driven, biostatisticians are expected not only to understand statistical theory but also to work efficiently with modern analytical tools. Mastering the right combination of foundational, advanced, and AI-supported tools is becoming essential for professionals entering this field.
Biostatistics
Build strong foundations in statistical methods used in clinical research and healthcare studies. Learn how clinical trial data is analyzed, interpreted, and validated to support evidence-based decisions and regulatory submissions.
Conclusion
Biostatistics in clinical research is no longer only about statistical theory—it is about using analytical tools to transform healthcare data into meaningful evidence. Tools such as SAS, R, Python, and SQL help analyze clinical data and support evidence-based healthcare decisions. The role of biostatistics in clinical research continues to expand with the growth of data-driven healthcare.
Building a career in biostatistics requires learning industry-relevant tools and gaining practical analytical experience. At CliniLaunch Research Institute, the Advanced Diploma in Biostatistics is designed exactly with this goal in mind bridging the gap between academic knowledge and industry requirements through tool-focused, application-driven learning.