What is clinical data management is a common question in clinical research, especially when trials generate large volumes of patient data across multiple sites, systems, and teams over long timelines. If this data is not collected and reviewed in a controlled way, even a well-designed study can produce unreliable results, making clinical data management in clinical trials essential for reliable outcomes.
Clinical Data Management exists to prevent this risk by defining how clinical trial data is captured, checked, corrected, stored, and prepared for analysis and regulatory review. Without a structured data management process, trial results cannot be trusted, and regulatory approval becomes uncertain, highlighting the growing importance of clinical data management in clinical research.
Clinical Data Management is important because clinical trial results are only as reliable as the data behind them.
It prevents inconsistent data entry, unresolved discrepancies, and safety data mismatches, ensuring trial data remains accurate, traceable, and acceptable for regulatory review.
What Is Clinical Data Management?
Clinical Data Management (CDM) is the process of handling clinical trial data so that it is accurate, complete, and usable. It covers how patient data is collected, checked, corrected, stored, and finalized during a clinical study.
In a clinical trial, patient information such as medical history, lab results, treatment details, and safety events is recorded at different study sites and entered electronic systems. CDM ensures this information is captured in a consistent format, reviewed for errors or missing values, corrected when needed, and documented properly. By the end of the trial, CDM delivers a clean and finalized database that accurately represents what happened during the study and is ready for analysis.
Why Clinical Trials Depend on Clinical Data Management
Clinical trials depend on clinical data management because trial results are only as reliable as the data used to produce them. Even a scientifically sound study can fail if the underlying data is incomplete, inconsistent, or poorly documented highlighting the importance of clinical data management.
Independent audits of clinical research data have shown that, without rigorous data management controls, datasets can contain anywhere from 2 to as high as 2,784 errors per 10,000 data fields, making it impossible to trust results without systematic data review. Without clinical data management, there is no reliable way to confirm that the collected data accurately reflects what occurred during the trial.
In real clinical trials, patient data is generated across multiple hospitals, investigators, laboratories, and external systems, often over long study durations. Data is entered by different teams, reviewed at different times, and updated as patients progress through the study. Without a structured data management process, discrepancies accumulate, safety information may not align across systems, and missing data goes unnoticed until late in the trial, causing delays and rework.
Clinical data management exists to control these risks. CDM teams ensure that data follows consistent definitions, validation rules, and review processes across all sites and sources. They identify errors early, manage queries with study sites, reconcile safety data, and maintain audit trails for every data change. This prevents data quality issues from reaching the analysis stage and protects the integrity of trial outcomes.
Advanced Diploma in
Clinical Research
Master end-to-end clinical trial management, from site monitoring and patient recruitment to regulatory documentation. This program provides hands-on training with industry-standard tools like EDC systems, CTMS, and eTMF, preparing you for immediate roles in CROs and Pharma.
Why Clinical Data Management Is Critical for Regulatory Approval
Regulatory authorities do not approve clinical trials based on positive outcomes alone. Approval depends on whether the submitted data is accurate, consistent, and transparently managed. Clinical data management ensures this by aligning trial execution with clinical data management guidelines and regulatory expectations.
From a regulator’s perspective, unreliable data invalidates conclusions. CDM ensures that every data point can be traced, reviewed, and explained, supporting ICH GCP compliance throughout the study. Clinical data management ensures that every data point submitted can be explained, verified, and traced back to its source, which is a fundamental expectation during regulatory review
Role of Clinical Data Management Teams in Ensuring Data Quality
Regulatory approval depends on the accuracy, completeness, and traceability of clinical trial data, and this responsibility sits directly with clinical data management teams. Clinical Data Managers oversee how data is collected, reviewed, and corrected across the trial, ensuring it aligns with the study protocol and regulatory requirements. They define review strategies, oversee query resolution, and monitor data quality throughout the study lifecycle.
Data Coordinators and Data Reviewers support this process by continuously checking patient records, laboratory results, and safety data for inconsistencies or missing information. Issues are identified early and resolved with trial sites before they escalate into submission delays or inspection findings. This continuous oversight is what keeps trial data consistent and defensible. These reflect evolving clinical data manager roles and responsibilities.
Role of CDM in Audit Readiness and Regulatory Submission
Complete audit trail documentation is critical during inspections. Clinical data management is central to audit readiness. Clinical Programmers and database-focused CDM professionals maintain validated data systems with complete audit trails that record every data change, including who made the change, when it was made, and why. During regulatory inspections, this traceability is not optional; it is scrutinized in detail.
Clinical programmers and database-focused CDM professionals maintain validated systems with a complete audit trail, recording who changed data, when, and why. This level of traceability is essential during inspections.
CDM teams also prepare clean, standardized datasets that are ready for statistical analysis and regulatory submission. These datasets must follow industry standards and be supported by complete documentation, allowing regulators to review trial data efficiently and confidently. Maintaining this level of control throughout the study supports inspection of readiness and aligns with ICH GCP expectations across the entire clinical trial lifecycle. These practices align with global clinical data management guidelines.
Supporting CDM Roles in Complex or Global Trials
In large or complex clinical trials, additional specialized roles strengthen data management and regulatory preparedness. Clinical Database Designers ensure that study databases are built correctly from the start, aligning data structures with the protocol and submission standards. Data Validation and Standards specialists focus on programmed checks and compliance with required industry formats, reducing the risk of submission of rework.
These roles exist for one reason: to prevent data quality issues from surfacing during regulatory review, when fixes are costly, time-consuming, and sometimes impossible.
Phases of Clinical Data Management
Clinical Data Management runs across the entire study, forming the complete clinical data management lifecycle. These stages together define the clinical data managementprocess used in real-world trials
Clinical Data Management does not happen at the end of a clinical trial. It runs alongside the study from planning to final submission, adapting its focus as the trial progresses. The objective remains constant throughout: ensure that clinical trial data is accurate, consistent, and ready for regulatory review.
In real-world clinical trials, CDM activities are structured across three main phases: Study Start-Up, Study Conduct, and Study Close-Out. Each phase controls a different category of data risk and prepares the study for the next stage of execution or review. Understanding these phases explains how CDM works in practice, not just in theory.
Study Start-Up Phase: Building the Data Foundation
The study’s start-up phase focuses on defining how trial data will be collected and controlled before the first patient is enrolled. Decisions made at this stage determine whether the trial will generate clean, usable data or struggle with inconsistencies for its entire duration.
During start-up, CDM teams translate protocol requirements into a case report form and design the database. The data management plan defines how data will be collected, reviewed, validated, and locked. These activities rely on specialized clinical data management tools. A well-designed database also supports data privacy and security across trial systems.
Common platforms include Medidata Rave, Oracle Clinical, Veeva Vault EDC, and OpenClinica—each an electronic data capture solution aligned with CDISC standards. Validation rules, data standards, and workflows are defined early, so that data is captured consistently across all sites from day one. Weak planning at this stage often leads to extensive rework, delayed timelines, and data quality issues that are difficult or expensive to fix later.
Common tools used in this phase include Electronic Data Capture (EDC) platforms such as Medidata Rave. It is a widely used electronic data capture platform in clinical trials, Oracle Clinical, Veeva Vault EDC, and OpenClinica. Industry data standards like CDISC are also applied early to ensure submission of readiness.
Study Conduct Phase: Controlling Data While the Trial Is Live
Following clinical data management best practices reduces downstream risk.
Once enrollment begins, CDM teams control data in real time, applying clinical data management to best practices. Data is collected from sites and labs, enabling source data verification and ongoing review.
During study conduct, CDM teams perform query management, reconciliation of patient safety data, application of medical coding, and continuous data validation checks, supporting effective data cleaning in clinical trials and maintaining clinical trial data quality. Effective query management prevents delays. The goal is to prevent data issues from accumulating and to ensure that safety and efficacy data remain aligned across systems throughout the trial.
This phase is critical because unresolved discrepancies, inconsistent safety reporting, or delayed data review can directly impact analysis of timelines and regulatory readiness. This supports ongoing data cleaning in clinical trials. All these platforms together function as a clinical data management system.
Common tools used in this phase include EDC query management modules, safety databases such as Argus, medical coding dictionaries like MedDRA and WHO-DD, and built-in reporting dashboards used to monitor data quality and study progress.
Study Close-Out Phase: Finalizing Data for Analysis and Submission
The close-out phase focuses on final reviews and database locks, after which data becomes final for analysis. Tools such as SAS and Pinnacle 21 validate submission of readiness and ensure standards of compliance. At this stage, data changes become highly restricted, making unresolved issues particularly risky.
CDM teams perform final data reviews, confirm that all queries are resolved, verify safety reconciliation, and complete final validation checks. This includes systematic data validation checks. Once these activities are complete, the database is locked. After database lock, the data is considered final and is used for statistical analysis and regulatory submission. Errors discovered after this point often result in delays, additional scrutiny, or challenges during regulatory review.
Common tools used in this phase include statistical and validation tools such as SAS for data consistency checks and Pinnacle 21 for validating submission-ready datasets against CDISC standards.
Why These Phases Matter
Each phase of clinical data management exists to control a specific type of risk. Study start-up prevents structural data issues; study conduct prevents uncontrolled data drift, and study close-out ensures regulatory confidence in the final dataset. Skipping rigor in any phase does not just create operational problems; it directly threatens trial timelines, data credibility, and regulatory approval.
CDM Phase
Primary Focus
What CDM Controls at This Stage
Typical Tools Involved
Study Start-Up
Planning and setup before enrollment
Defines what data is collected, how it is captured, and how it will be validated to avoid structural data issues later
EDC systems (Medidata Rave, Oracle Clinical, Veeva Vault EDC, OpenClinica), CDISC standards
Study Conduct
Ongoing data monitoring during the trial
Ensures data completeness, consistency, and alignment across sites and systems while patients are active
Confirms all data is accurate, resolved, validated, and locked for regulatory use
SAS, Pinnacle 21, submission validation tools
Skills Needed for Clinical Data Management (CDM)
Clinical Data Management is not just about knowing tools or following checklists. CDM professionals balance technical execution with regulatory discipline. Understanding clinical data manager roles and responsibilities is key to career progression. CDM professionals sit at the intersection of trial execution, data integrity, and inspection readiness, which is why their skill set must balance technical execution, process awareness, and regulatory discipline.
Core Technical Skills
Data Quality Review Maintaining clinical trial data quality is the primary goal. CDM professionals must be able to identify missing, inconsistent, or illogical data before it reaches analysis. This skill ensures that trial data reflects what happened at the site, not what was assumed or incorrectly recorded. Weak data review leads to unreliable results and last-minute rework during close-out.
Resolving Data Inconsistencies Identifying issues is not enough. CDM professionals must raise precise queries, track responses, and ensure corrections are properly documented. This ability directly impacts audit readiness, because regulators expect to see not just corrected data, but a clear record of how and why changes were made.
CRF-Based Data Understanding Understanding How Case Report Forms are designed and used helps ensure that patient data is captured consistently across sites. Poor CRF understanding often results in incorrect or incomplete data entry, increasing query volume, and slowing down the entire trial.
CDM Process and Regulatory Skills
Clinical Trial Flow Awareness CDM professionals must understand how data moves across study start-up, conduct, and close-out phases. This awareness helps them prioritize reviews, anticipate risks, and prevent bottlenecks at critical milestones such as database lock and submission preparation.
Protocol and Data Management Plan Interpretation The protocol and Data Management Plan define what data must be collected and how it should be handled. CDM professionals must be able to interpret these documents accurately, because misalignment between protocol intent and data handling rules leads to compliance issues and regulatory questions.
Regulatory Readiness Awareness CDM teams must work with the assumption that trial data will be inspected. Understanding audit trails, traceability, and inspection expectations ensures that data remains defensible throughout the study and reduces the risk of findings during regulatory review. These controls support ICH GCP compliance.
Tools and Systems Skills
EDC Platform Proficiency Hands-on experience with Electronic Data Capture systems is essential for managing CRFs, queries, validations, and database lock activities. Proficiency in EDC platforms enables CDM teams to control data quality efficiently and respond quickly to issues as they arise.
Clinical Coding Standards Knowledge of coding dictionaries such as MedDRA and WHO-DD allows CDM professionals to standardize adverse events and medication data. Consistent coding is critical for accurate safety analysis and regulatory reporting.
Reporting and Review Tools Dashboards and reports are used to track data completeness, open queries, validation status, and site performance. The ability to interpret these reports helps CDM teams identify risks early and take corrective action before issues escalate.
Key Deliverables of Clinical Data Management
In clinical research, data only has value when it is complete, traceable, and acceptable for regulatory review. Clinical Data Management is measured not by how much data is collected, but by the quality and usability of what is ultimately delivered.
Clinical Data Management delivers three critical outcomes:
Clean and complete datasets that reflect real patient outcomes
Analysis-ready, locked databases for reporting and submission
Regulatory-compliant datasets and documentation required for review by authorities
1. Clean and Complete Clinical Trial Data
What this means Clinical data management delivers datasets where patient information is accurate, consistent, and complete across all trial sites and data sources. Data issues are identified early, corrected systematically, and fully documented throughout the study lifecycle.
Why this matters If data is incomplete or inconsistent, trial results cannot be trusted. Clean data ensures that analyses reflect real patient outcomes and prevents last-minute rework that can delay database lock or raise regulatory concerns.
2. Analysis-Ready and Locked Database
What this means CDM teams deliver a finalized database in which all queries are resolved, safety data is reconciled, and validation checks are complete. Once the database is locked, no further changes are permitted.
Why this matters The locked database becomes the single source of truth for statistical analysis and clinical study reports. Any unresolved issues at this stage directly affect analysis of timelines and can delay regulatory submissions.
3. Regulatory-Compliant Datasets and Documentation
What this means Clinical data management produces standardized, traceable datasets supported by complete documentation, including audit trails and validation reports. These deliverables demonstrate how data was collected, reviewed, and finalized.
Why this matters Regulatory authorities assess not just study results, but the integrity of the data behind them. Agencies such as the U.S. FDA require submitted study data to follow defined data standards for review by CDER and CBER. Without regulatory-ready datasets and documentation, even well-designed trials face delays, additional scrutiny, or rejection.
The Road Ahead
Clinical Data Management sits at the core of how modern clinical trials succeed or fail. It determines whether trial data is reliable, and acceptable for regulatory review. From study planning to database lock, CDM connects patient data with scientific analysis and regulatory decision-making, directly influencing trial timelines, data integrity, and patient safety.
As clinical trials become more global, data-driven, and inspection-focused, the demand for professionals who understand real-world data processes continues to grow. Building a career in clinical data management requires more than theoretical knowledge; it requires hands-on exposure to how data is handled across a trial lifecycle. Programs like the Advanced Diploma in Clinical Research at Clinical Research Training Institute focus on this practical understanding, preparing learners to step into clinical data roles with clarity and industry relevance.
Frequently Asked Questions – (FAQs)
1. What issues does clinical data management help avoid clinical trials?
Clinical data management prevents issues such as inconsistent data entry, unresolved discrepancies, misaligned safety reporting, and missing documentation, all of which can delay database lock and regulatory review.
2. How does a Data Management Plan guide for a clinical trial?
A Data Management Plan defines how data will be collected, reviewed, validated, and locked. A weak DMP leads to inconsistent handling of data across sites, while a clear DMP reduces rework and inspection risk.
3. Why are data queries important in clinical trials?
Query management is the process of identifying data issues, raising questions to sites, and tracking responses. Poor query management causes unresolved discrepancies to pile up, delay data cleaning, and database locking.
4. How do CRFs affect data accuracy in clinical studies?
A Case Report Form determines how patient data is captured at sites. Poorly designed CRFs increase data entry errors and query volume, directly affecting clinical trial data quality.
5. How does Electronic Data Capture support the clinical data management process?
Electronic Data Capture systems standardize data collection, apply real-time data validation checks, and maintain audit trails, helping CDM teams manage data efficiently across multiple trial sites.
6. Why is database lock considered a critical milestone?
Database lock marks the point at which data is finalized, and no further changes are allowed. Any unresolved issues at this stage directly impact analysis timelines and regulatory submissions.
7. How does clinical data management address data privacy and security?
Clinical data management systems control user access, track all data changes, and protect patient identifiers, ensuring data privacy and security throughout the clinical data management lifecycle.
8. Why is medical coding essential for patient safety data?
Medical coding standardizes adverse events and medication data, allowing consistent safety analysis and supporting regulatory review across different sites and regions.
9. What is the role of audit trails in ICH GCP compliance?
Audit trails record who made data changes, when they were made, and why. Regulators rely on audit trails to assess data integrity and verify compliance with ICH GCP guidelines.
10. How do data validation checks and source data verification work together?
Data validation checks identify inconsistencies within the database, while source data verification confirms accuracy against original patient records. Together, they support reliable data cleaning in clinical trials.
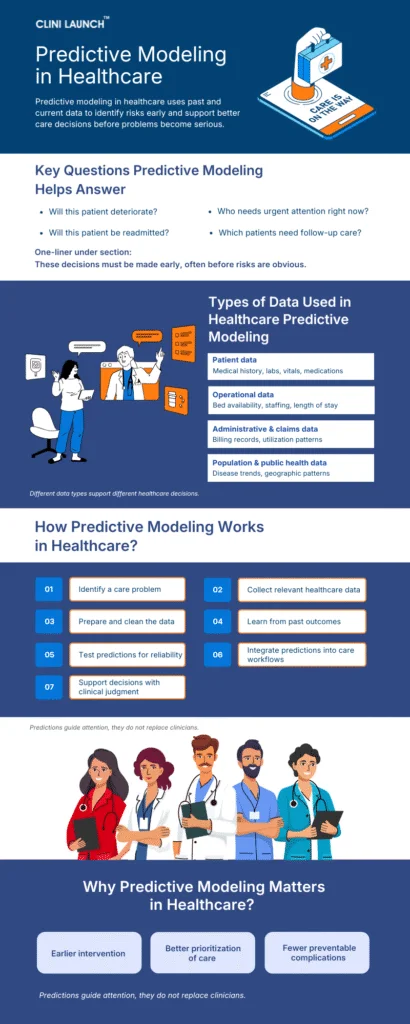
Predictive modelling in healthcare is about using patient data to make better decisions before health problems become serious. Instead of waiting for a patient’s condition to worsen, hospitals and doctors use data from past cases to understand what might happen next.
In healthcare, many problems do not appear suddenly. Patients often show small warning signs long before complications, readmissions, or emergencies occur. These signs are easy to miss when care teams are busy or working with limited information.
Predictive modeling helps identify these risks early. It supports healthcare teams in deciding who may need closer attention, extra follow-up, or timely treatment. Before looking at how it works or the methods behind it, it is important to first understand what predictive modeling means in a healthcare setting and why it is used.
In this blog, you’ll learn what predictive modeling means in a healthcare context, the kinds of problems it solves, how it works at a high level, and where it is used in real-world patient care.
What Is Predictive Modeling in Healthcare?
Predictive modeling in healthcare is the use of data to estimate what is likely to happen next, so healthcare teams can act earlier and make better decisions.
At its core, it works by looking at patterns from the past and applying them to current situations. When similar conditions appear again, predictive modeling helps signal possible risks, outcomes, or needs before they become obvious problems.
What Data Does It Use?
Predictive modeling in healthcare can use several kinds of data, depending on the problem being addressed:
Patient data for clinical data analysis, such as medical history, lab results, vital signs, medications, and treatment timelines
Operational data, such as bed availability, staff workload, length of stay, and patient flow
Administrative and claims data, including billing records, procedure codes, and healthcare utilization patterns
Population and public health data for population health analytics, such as disease trends, geographic patterns, and seasonal outbreaks
Each type of data helps predict different kinds of outcomes. Patient data supports clinical care decisions, while operational and population data support hospital planning and public health management.
POST GRADUATE DIPLOMA IN
AI and ML in Healthcare
Acquire the skills to develop and apply Artificial Intelligence and Machine Learning algorithms to medical diagnosis, treatment planning, and drug discovery. This program focuses on transforming healthcare delivery through predictive analytics and automated data-driven insights.
What Problems Predictive Modeling Solves in Healthcare
Predictive modeling is used in healthcare because many important decisions must be made early, often before problems are obvious. In real clinical environments, doctors and care teams work under time pressure and with incomplete information. When risks are identified late, patients face avoidable complications, and healthcare systems absorb unnecessary strain. Predictive modeling exists to reduce this gap by helping teams anticipate what may happen next and act while there is still time to intervene. Below we are discussing some of the most common predictive modeling healthcare applications today.
Will This Patient Deteriorate?
In hospitals, patient deterioration is rarely sudden. Most patients show subtle warning signs long before a serious event occurs. Small changes in vital signs, lab values, oxygen levels, or mental status may indicate that a patient’s condition is worsening. However, these changes are easy to miss during routine checks, especially when clinicians are responsible for many patients at once.
Predictive modeling helps by analyzing patterns across time rather than isolated measurements. By comparing current patient trends with historical cases, it can flag patients who are at higher risk of deterioration even when they appear clinically stable. This allows care teams to increase monitoring, adjust treatment, or escalate care earlier, reducing the chances of sudden emergencies such as cardiac arrest or unplanned ICU transfer.
Case Study: Early Warning Systems for Patient Deterioration – Acute Care & ICU Settings (Philips, 2020)
Hospitals have implemented predictive early warning systems that continuously analyze vital signs and monitoring data to detect patient deterioration hours before visible clinical collapse.
These systems generate risk scores that alert care teams when subtle physiological patterns suggest rising danger, even if patients appear clinically stable during routine checks.
In real-world deployments, hospitals reported up to a 35% reduction in adverse events and an over 86% decrease in cardiac arrests after integrating predictive alerts into clinical workflows.
This case demonstrates how predictive modeling significantly improves patient safety by enabling earlier intervention and faster escalation of care.
Will This Patient Be Readmitted?
Hospital readmissions are often driven by issues that occur after discharge rather than during the hospital stay itself. Patients may struggle with medication management, fail to attend follow-up appointments, misunderstand discharge instructions, or lack adequate support at home. These factors are difficult for clinicians to assess consistently using manual judgment alone.
Predictive modeling helps identify patients who are more likely to be readmitted before they leave the hospital. By recognizing patterns associated with past readmissions, healthcare teams can focus additional support on higher-risk patients. This may include clearer discharge education, early follow-up appointments, medication reconciliation, or post-discharge check-ins. The goal is not to prevent discharge, but to improve recovery and reduce avoidable returns to the hospital.
Case Study: Reducing Hospital Readmissions with Predictive Modeling – Corewell Health (USA)
Corewell Health used predictive modeling to identify patients at high risk of 30-day hospital readmission at the time of discharge. The system combined clinical data with behavioral and social factors to generate risk scores, which were reviewed by clinicians and care coordination teams.
Rather than relying on prediction alone, high-risk patients received targeted follow-up support, improved discharge planning, and focused transition-of-care interventions. This approach demonstrates direct, real-world use of predictive analytics to improve healthcare outcomes.
Over approximately 20 months, this strategy prevented around 200 avoidable readmissions and generated nearly USD 5 million in cost savings.
This case highlights that predictive modeling in healthcare works best when risk identification is paired with human clinical judgment and timely clinical action, rather than fully automated decisions.
Who Needs Urgent Attention Right Now?
In emergency departments and busy hospital wards, not all patients can be treated immediately. Patients often arrive with similar symptoms, and some may appear stable even though their condition is likely to worsen in the next few hours. Relying only on visible symptoms or arrival order can delay care for those at highest risk.
Predictive modeling supports prioritization by estimating which patients are more likely to deteriorate in the near term. This allows care teams to direct attention toward higher-risk patients sooner, even if they do not yet appear critically ill. As a result, urgent cases are less likely to be overlooked, and delays that lead to adverse outcomes can be reduced.
Case Study: Suicide Risk Prediction Using EHR Data – Vanderbilt University Medical Center (USA)
Vanderbilt University Medical Center developed a machine learning–based system that analyzes routine electronic health record (EHR) data to estimate suicide risk during patient encounters. The model runs silently in the background, grouping patients by risk level so clinicians can identify individuals who may need mental health screening even when no obvious warning signs are present.
During evaluation, the system identified a high-risk group that accounted for over one-third of subsequent suicide attempts, demonstrating how predictive modeling can surface hidden risk early.
This case highlights how predictive analytics supports earlier screening and prevention for rare but critical outcomes by complementing clinical judgment rather than replacing it.
Will This Patient Be Readmitted?
Hospital readmissions are often driven by issues that occur after discharge rather than during the hospital stay itself. Patients may struggle with medication management, fail to attend follow-up appointments, misunderstand discharge instructions, or lack adequate support at home. These factors are difficult for clinicians to assess consistently using manual judgment alone.
Predictive modeling helps identify patients who are more likely to be readmitted before they leave the hospital. By recognizing patterns associated with past readmissions, healthcare teams can focus additional support on higher-risk patients. This may include clearer discharge education, early follow-up appointments, medication reconciliation, or post-discharge check-ins. The goal is not to prevent discharge, but to improve recovery and reduce avoidable returns to the hospital.
Case Study: Reducing Hospital Readmissions with Predictive Modeling – Corewell Health (USA)
Corewell Health used predictive modeling to identify patients at high risk of 30-day hospital readmission at the time of discharge. The system combined clinical data with behavioral and social factors to generate risk scores, which were reviewed by clinicians and care coordination teams.
Rather than relying on prediction alone, high-risk patients received targeted follow-up support, improved discharge planning, and focused transition-of-care interventions. This represents a direct and practical use of predictive analytics for improving healthcare outcomes.
Over approximately 20 months, this approach prevented around 200 avoidable readmissions and generated nearly USD 5 million in cost savings.
Who Needs Urgent Attention Right Now?
In emergency departments and busy hospital wards, not all patients can be treated immediately. Patients often arrive with similar symptoms, and some may appear stable even though their condition is likely to worsen in the next few hours. Relying only on visible symptoms or arrival order can delay care for those at highest risk.
Predictive modeling supports prioritization by estimating which patients are more likely to deteriorate in the near term. This allows care teams to direct attention toward higher-risk patients sooner, even if they do not yet appear critically ill. As a result, urgent cases are less likely to be overlooked, and delays that lead to adverse outcomes can be reduced.
Case Study: Suicide Risk Prediction Using EHR Data – Vanderbilt University Medical Center (USA)
Vanderbilt University Medical Center developed a machine learning–based system that analyzes routine electronic health record (EHR) data to estimate suicide risk during patient encounters.
The model runs silently in the background, grouping patients by risk level so clinicians can identify individuals who may need mental health screening even when no obvious warning signs are present.
During evaluation, the system identified a high-risk group that accounted for over one-third of subsequent suicide attempts, demonstrating how predictive modeling can surface hidden risk early.
This case highlights how predictive analytics enables earlier screening and prevention for rare but critical outcomes by supporting proactive clinical decision-making.
Which Patients Need Follow-Up Care?
After diagnosis or treatment, maintaining follow-up is a major challenge in healthcare. Some patients miss appointments, delay recommended tests, or discontinue treatment, which can lead to late diagnoses, disease progression, or emergency visits. Following up with every patient at the same level is not realistic given limited resources.
Predictive modeling helps identify patients who are more likely to miss follow-ups or develop complications if care is interrupted. By focusing reminders, outreach, and follow-up efforts on these patients, healthcare teams can improve continuity of care and prevent avoidable deterioration outside the hospital setting.
Case Study: Early Sepsis Detection Using Machine Learning – ICU & Hospital Research Deployments
Machine learning models trained on large clinical datasets have demonstrated the ability to identify sepsis risk earlier than traditional scoring systems.
By continuously analyzing trends in vital signs and laboratory results, these models detect early warning signals hours before sepsis becomes clinically obvious.
Research-based deployments consistently show earlier detection and improved risk discrimination, forming the foundation for real-time sepsis alert systems now used in hospitals.
This case reinforces the role of predictive modeling in preventing life-threatening complications through timely identification and early clinical intervention.
How Predictive Modeling Works in Healthcare (Explained Through Real Healthcare Scenarios)
Predictive modeling in healthcare is not built in isolation by data teams. It is shaped by real clinical problems, real patient behavior, and real operational constraints. Each step in the process exists because healthcare decisions carry risk, and getting even one step wrong can lead to unsafe or misleading predictions.
To understand how predictive modeling works in practice, it helps to walk through the process as it unfolds inside a healthcare setting.
Defining the Problem: Starting With a Care Gap
Predictive modeling begins when healthcare teams notice a recurring problem they cannot reliably manage using observation alone. For example, a hospital may realize that many patients who end up in the ICU showed warning signs earlier, but those signs were not recognized in time. In another case, leadership may notice that readmissions are high even though discharge criteria are being followed correctly.
At this stage, the goal is not to build a model, but to clearly define what needs to be predicted. Is the priority to identify deterioration early? To prevent readmissions? To prioritize patients during peak workload? In healthcare, vague questions lead to unsafe predictions, so this step ensures the model is built to support a specific clinical decision.
Gathering Data: Reconstructing the Patient Journey
Once the problem is clear, healthcare teams collect data that reflects how care actually unfolds. For patient deterioration, this includes vital signs, lab results, oxygen levels, medications, and how these values change over time. For readmissions, the data may include discharge timing, medication changes, prior hospital visits, and follow-up history.
This step is critical because healthcare outcomes are rarely caused by a single factor. Predictive modeling depends on understanding patterns across entire patient journeys, not isolated snapshots. Without the right data, predictions may overlook the very signals clinicians are trying to catch early.
Preparing the Data: Making Sure the Story Is Accurate
Healthcare data is often messy because it is collected across multiple systems and departments. A patient’s lab results may be recorded in one system, vital signs in another, and discharge information elsewhere. Incomplete or inconsistent records can distort patterns and create false signals.
Before any learning can occur, the data must be aligned so it tells a consistent story. This step matters because predictive models do not understand context; they only learn from what they are given. In healthcare, poor data preparation can translate directly into unsafe recommendations.
Learning From Past Outcomes: Finding What Actually Comes Before Trouble
With reliable data in place, predictive modeling looks backward before it looks forward. It examines previous patient cases to understand what typically happened before certain outcomes occurred. For example, it may reveal that patients who were later readmitted often showed specific lab trends, medication changes, or follow-up gaps in the days before discharge.
This step is important because healthcare intuition alone is not enough at scale. While clinicians may recognize patterns in individual cases, predictive modeling helps confirm which signals consistently matter across hundreds or thousands of patients.
Testing Predictions: Making Sure Patterns Hold Up
Not every pattern discovered in data is meaningful. Some patterns appear by chance or reflect temporary conditions. Before predictions are trusted, they must be tested against real historical cases to ensure they reliably identify risk without generating excessive false alarms.
In healthcare, this step is essential for safety. A model that flags too many patients creates alert fatigue, while one that misses risk undermines trust. Testing ensures predictions strike the right balance between sensitivity and usefulness in real clinical environments.
Integrating Into Care: Making Predictions Usable
Even accurate predictions are useless if they do not fit into clinical workflows. Healthcare professionals do not have time to interpret complex outputs or separate dashboards. Predictive insights must be presented in a simple, actionable form, such as a risk score or early warning indicator within existing systems.
This step matters because healthcare decisions are made quickly and often under pressure. Predictive modeling succeeds only when it supports, rather than disrupts, how care is delivered.
Acting With Clinical Judgment: Supporting, Not Replacing, Care Teams
Predictions are designed to draw attention, not dictate action. When a patient is flagged as high risk, clinicians assess the situation in context, considering factors that data may not capture, such as patient behavior, social support, or recent changes in condition.
This step exists because healthcare is not deterministic. Predictive modeling provides early signals, but human judgment remains essential to ensure safe and appropriate care.
Monitoring Over Time: Keeping Predictions Relevant
Healthcare does not stand still. Treatment protocols evolve, patient populations change, and hospital workflows adapt. Predictive models must be monitored to ensure they remain accurate and fair as conditions change.
This step is especially important in healthcare because outdated predictions can be as harmful as incorrect ones. Ongoing monitoring ensures that predictive modeling continues to support patient safety and care quality over time.
POST GRADUATE DIPLOMA IN
Biostatistics
Master the development and application of statistical methods to health data. This program equips you with the technical expertise to analyze complex biomedical data, interpret research findings, and drive evidence-based practice in public health and life sciences.
Advanced Biostatistical Modeling, Survival Analytics, Epidemiological Data Analysis, Data Visualization, and Proficiency in Statistical Software (R/SAS)
How Healthcare Systems Learn Patterns: Algorithms Used in Predictive Modeling
Once healthcare data is prepared and past outcomes are understood, the next question is simple: how does the system actually learn from this information? This is where algorithms come in.
An algorithm, in this context, is a method that helps the system learn patterns from past healthcare data. When an algorithm is trained on real data, it produces a predictive model that can estimate risk for new patients or situations. Different healthcare problems require different learning approaches, which is why multiple algorithms are used instead of one universal method.
Many healthcare decisions involve a clear yes-or-no question. Will a patient be readmitted? Is there a high risk of complications? Should closer monitoring be triggered? Logistic regression is commonly used in these situations because it focuses on estimating probability rather than making absolute claims.
Healthcare teams value this approach because it produces clear risk scores and is relatively easy to interpret. Clinicians can understand which factors contribute to higher risk, making it suitable for decisions that must be explained, reviewed, or audited. It is often used as a first-line approach for clinical risk prediction because it balances simplicity, transparency, and usefulness.
Decision Trees: Mimicking Clinical Reasoning
In many healthcare settings, decisions follow logical steps. Clinicians often think in terms of conditions and thresholds, such as whether a lab value is above or below a certain level or whether specific symptoms are present. Decision trees reflect this type of reasoning by breaking decisions into a sequence of simple rules.
This approach is useful when explainability is critical. Clinicians can follow the decision path and understand how a conclusion was reached. While decision trees may not always provide the highest accuracy, they align well with clinical workflows and guideline-based decision-making.
Random Forests: Improving Reliability in Complex Cases
Healthcare data is rarely clean or consistent. A single decision tree can be sensitive to small variations in data, which may lead to unstable predictions. Random forests address this by combining many decision trees and using their collective output to make predictions.
This approach improves reliability and accuracy, especially when dealing with complex patient data from electronic health records. While random forests are harder to explain than a single decision tree, they are often used when healthcare teams need stronger performance and are willing to trade some interpretability for better prediction quality.
Neural Networks and Deep Learning: Learning From Complex Data
Some healthcare data is too complex for rule-based or statistical approaches. Medical images, physiological signals, and genomic data contain patterns that are difficult for humans to define explicitly. Neural networks and deep learning are designed to learn these patterns directly from large volumes of data.
These approaches are commonly used in areas such as medical imaging and diagnostics, where accuracy is critical and patterns are not obvious. Because they are harder to interpret, they are usually deployed with additional validation and oversight, especially in clinical environments.
Survival Analysis: Understanding When Events May Happen
In healthcare, timing often matters as much as risk. Clinicians may need to know not just whether an event will occur, but when it is likely to occur. Survival analysis focuses on time-based outcomes, such as how long before a patient is readmitted or how disease risk changes over time.
This approach is widely used in clinical research and long-term care planning because it handles follow-up data naturally and provides insight into how risk evolves. It is particularly valuable when outcomes unfold gradually rather than immediately.
Why Healthcare Uses Multiple Algorithms
No single algorithm can handle every healthcare problem safely or effectively. Some situations demand clarity and explainability, while others demand higher accuracy or the ability to handle complex data. Healthcare teams choose algorithms based on the clinical question, the type of data available, and how predictions will be used in practice.
This is why predictive modeling in healthcare is not about finding the “best” algorithm, but about choosing the right learning approach for the right decision.
Limitations of Predictive Modeling in Healthcare
Predictive modeling can improve decision-making in healthcare, but it is not a flawless solution. Because predictions influence real patient care, understanding the limitations of predictive modeling is essential. When these systems are misunderstood or overtrusted, they can introduce new risks rather than reduce existing ones.
Data Quality Directly Limits Prediction Quality
Predictive models depend entirely on the data they learn from. In healthcare, data is often incomplete, inconsistent, or fragmented across multiple systems. Patients may receive care from different hospitals, labs, and providers, and important information may be missing or recorded differently. When predictive models are trained on this kind of data, they learn from an imperfect representation of reality. This can result in predictions that appear precise but are fundamentally unreliable. Predictive modeling cannot correct poor data quality; it only reflects it.
Bias in Historical Data Can Be Reinforced
Predictive modeling learns from past healthcare decisions and outcomes. If historical data reflects unequal access to care, delayed treatment, or systemic bias against certain patient groups, those patterns can be unintentionally carried forward. This can lead to underestimating risk for some populations while overestimating it for others. In healthcare, where equity and safety are critical, unmanaged bias can worsen existing disparities rather than improve care.
Limited Understanding of Human and Social Context
Predictive models do not understand patients as individuals. They lack awareness of social circumstances, emotional state, family support, or sudden life changes unless these factors are explicitly captured in data. A patient may be classified as low risk based on clinical indicators while still facing significant challenges outside the healthcare system. This limitation makes it essential for predictions to be interpreted alongside clinical judgment and real-world context.
Risk of Over-Reliance and Alert Fatigue
Predictive modeling produces probabilities, not certainties. However, in practice, there is a risk of treating predictions as definitive answers. Over-reliance on risk scores or alerts can lead to unnecessary interventions or missed edge cases. In busy clinical environments, frequent alerts can also cause fatigue, reducing attention to genuinely critical signals. Predictive modeling should guide attention, not replace decision-making.
Models Can Become Outdated Over Time
Healthcare environments evolve continuously. Treatment protocols change, patient populations shift, and new conditions emerge. Predictive models trained on older data may lose accuracy if they are not regularly reviewed and updated. Without ongoing monitoring, even well-performing models can become misleading, creating false confidence in outdated predictions.
Regulatory, Ethical, and Trust Constraints
Healthcare is a highly regulated domain. Predictive models must be explainable, auditable, ethical, and aligned with patient safety standards. Clinicians are less likely to trust systems they cannot understand or challenge. Patients may also feel uneasy when care decisions appear to be driven by opaque systems. These concerns limit how predictive modeling can be deployed, especially in high-stakes clinical settings.
Why These Limitations Matter
Predictive modeling delivers value only when its limitations are clearly understood. It is most effective when used as a decision-support tool, not a decision-maker. Recognizing where predictive modeling can fail helps healthcare teams apply it responsibly, combine it with clinical expertise, and avoid false confidence. In healthcare, the goal is not perfect prediction, but safer and earlier decision-making.
Future Trends in Predictive Modeling in Healthcare
Predictive modeling in healthcare is evolving, not because of flashy algorithms, but because healthcare itself is changing. Data availability is improving, care is moving beyond hospital walls, and expectations around safety and accountability are rising. These shifts are shaping how predictive modeling will be built and used in the coming years.
From Static Predictions to Real-Time Risk Monitoring
Early predictive models were often run periodically, using snapshots of patient data. The future is moving toward continuous, real-time risk assessment. Instead of generating a score once a day or at discharge, predictive systems will update risk levels as new lab results, vitals, or monitoring data arrive.
This matters because patient conditions change quickly. Real-time prediction allows healthcare teams to respond to early signals as they emerge, rather than discovering risk after deterioration has already begun.
Predictive Modeling Extending Beyond Hospitals
Predictive modeling is no longer confined to inpatient care. As healthcare shifts toward outpatient, home-based, and virtual care, predictive systems are being used to monitor patients outside traditional clinical settings. Data from wearables, remote monitoring devices, and follow-up interactions are increasingly incorporated into risk assessment.
This expansion supports earlier intervention for chronic conditions, post-discharge recovery, and home-based care, helping prevent avoidable hospital visits before they occur.
Greater Emphasis on Explainability and Transparency
As predictive modeling becomes more embedded in care decisions, explainability is becoming non-negotiable. Clinicians need to understand why a patient is flagged as high risk, not just that they are. Regulators and healthcare organizations are also demanding clearer documentation of how predictions are generated and used.
Future predictive systems will place greater emphasis on transparent reasoning, traceable inputs, and interpretable outputs so predictions can be reviewed, questioned, and trusted.
Increased Use of Combined and Hybrid Approaches
Healthcare problems rarely fit neatly into one modeling approach. Future predictive systems will increasingly combine multiple learning methods to balance accuracy, timing, and interpretability. Simpler approaches may be used for early screening, while more complex methods refine predictions in the background.
This hybrid approach reflects a practical shift away from searching for a single “best” model toward building systems that work reliably across different stages of care.
Stronger Governance, Monitoring, and Accountability
As predictive modeling influences more clinical decisions, healthcare organizations are placing stronger controls around how models are deployed and maintained. Continuous monitoring for accuracy, bias, and unintended consequences is becoming standard practice rather than an afterthought.
This trend reflects a broader understanding that predictive modeling is not a one-time implementation, but a living system that must be governed throughout its lifecycle.
Beyond individual patient care, predictive modeling is increasingly used to support population health and system-level planning. Health systems and public health agencies are using predictions to anticipate demand, manage staffing, prepare for disease surges, and allocate resources more effectively.
At this level, predictive modeling helps healthcare systems prepare rather than react, improving resilience during periods of stress.
Conclusion
Predictive modeling is not about predicting the future with certainty. In healthcare, its value lies in helping teams recognize risk earlier, make more informed decisions, and intervene before problems escalate. When used responsibly, it supports safer care, better prioritization, and more efficient use of limited resources.
As healthcare continues to generate more data and operate under increasing pressure, the ability to interpret patterns and act early will only become more important. Predictive modeling provides a structured way to do that, but its impact depends on how well it is understood, implemented, and combined with clinical judgment.
For professionals looking to build practical skills in this space, understanding predictive modeling in a healthcare context is no longer optional. Clinical Research Training Institute offers industry-ready programs, including AI and ML in Healthcare, designed to bridge the gap between healthcare knowledge and real-world data applications. These programs focus on applied learning that aligns with how predictive modeling is actually used across hospitals, clinical research, and digital health.
FAQs
1. What Is the Role of Predictive Analytics in Healthcare?
Predictive analytics helps healthcare teams make better decisions ahead of time. Instead of reacting after something goes wrong, it helps identify risks early, prioritize patients who need attention, and improve planning for care and resources.
2. How Are Machine Learning and Data Science Used in Healthcare?
Machine learning and data science are used to analyze large amounts of healthcare data, such as patient records, test results, and medical images. They help find patterns that are hard to see manually and support predictions related to diagnosis, risk, and treatment outcomes.
3. How Is Predictive Modeling Used in Medical Research?
In medical research, predictive modeling helps researchers understand how diseases progress and how patients may respond to treatments. It is used to study trends, identify risk factors, and support better study design and clinical decision-making.
4. What Are the Benefits of Predictive Analytics for Healthcare Outcomes?
Predictive analytics improves healthcare outcomes by enabling early intervention, reducing avoidable complications, lowering readmission rates, and supporting more personalized care. It also helps healthcare systems work more efficiently.
5. How Is Predictive Modeling Used in Healthcare?
Predictive modeling is used to identify high-risk patients, support clinical decisions, prioritize care, plan follow-ups, and reduce preventable hospital visits. It helps healthcare teams focus their efforts where they matter most.
6. What Are Examples of Predictive Analytics in Healthcare?
Common examples include predicting patient deterioration, identifying readmission risk, detecting disease early, prioritizing emergency care, and forecasting long-term health outcomes for chronic conditions.
7. How Does Machine Learning Improve Healthcare Predictions?
Machine learning improves healthcare predictions by learning from large volumes of past data and continuously refining patterns. This allows predictions to become more accurate over time, especially in complex cases where simple rules are not enough.
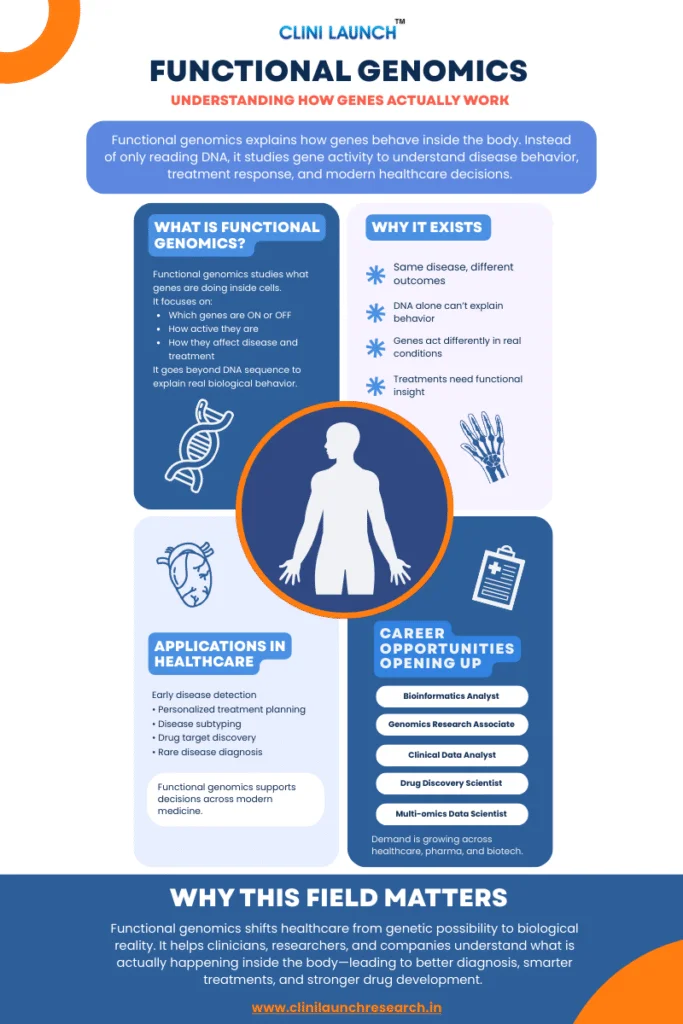
Functional Genomics in Healthcare
Functional genomics in healthcare exists because knowing what is written in DNA is no longer enough to understand how diseases behave in real patients. People with the same diagnosis and similar genetic reports often experience very different symptoms, disease progression, and treatment outcomes.
Traditional genetic testing identifies DNA variations, but it often cannot explain how those genes behave inside the body or why outcomes vary so widely. Clinical resources such as MedlinePlus from the U.S. National Library of Medicine highlight this limitation, which pushed healthcare toward approaches that study gene activity, biological pathways, and molecular behavior instead of DNA sequence alone.
This blog introduces what functional genomics is, why it became necessary in modern healthcare, and how it is applied today through real-world examples.
Functional genomics in healthcare studies how genes and their products (RNA and proteins) function in the body to explain disease behavior and treatment response. Instead of focusing only on DNA sequences, it analyzes gene expression, molecular pathways, and biological activity to improve diagnosis, therapy selection, and understanding of disease progression.
What Is Functional Genomics?
Functional genomics is the study of how genes function inside the body, not just what their DNA sequence looks like. Instead of focusing only on which genes are present, it examines how genes behave, when they are active, and how they influence biological processes in real conditions.
Genes are constantly being switched ON and OFF. Some activate only during illness or stress, while others remain silent. Functional genomics focuses on gene expression analysis to understand what is actually happening inside cells as diseases develop or respond to treatment.
Traditional Genomics vs Functional Genomics
Traditional genomics provides static information about DNA, which rarely changes. Functional genomics captures dynamic biological activity, showing how genes interact with proteins, pathways, and cellular systems over time.
In simple terms, traditional genomics tells us what could happen, while functional genomics explains what is happening right now. This distinction is critical for understanding complex diseases.
Case Study: Rheumatoid Arthritis and the Limits of Genetic Risk
Aspect
Details
The Problem
Thousands of genetic variants are linked to rheumatoid arthritis, yet many patients do not respond to treatment.
What Functional Genomics Revealed
Analysis of DNA folding and gene regulation in immune cells identified which genes were actually affected.
What Changed
New disease-driving pathways were identified that required activation rather than inhibition.
Why This Matters
Functional genomics transformed genetic associations into actionable biology.
What Functional Genomics Is NOT
Not just DNA sequencing: It focuses on gene activity, not only DNA reading.
Not a single test: It combines multiple biological datasets.
Not limited to cancer: Used in autoimmune, neurological, metabolic, and rare diseases.
Not a replacement for clinicians: It supports medical decisions, not replaces them.
Not only experimental: Already used in diagnostics and treatment planning.
What Is the Need for Functional Genomics?
Modern healthcare reached a point where genetic information alone stopped being sufficient. DNA sequencing can identify mutations, but it often fails to explain disease behavior or treatment outcomes.
Diseases such as cancer and autoimmune disorders involve networks of genes and pathways that change over time. Functional genomics addresses this by focusing on gene activity rather than genetic potential.
Functional genomics is actively used in pharmaceutical research. Companies like AstraZeneca apply it to link genetic data with biological function and improve drug discovery outcomes.
Case Study: Genome-Scale Cancer Target Discovery
Aspect
Details
The Problem
Cancer drug development fails frequently and late in trials.
What Functional Genomics Revealed
CRISPR screening identified genes cancers truly depend on.
What Changed
Drug targets could be prioritized with higher success probability.
Why This Matters
Functional genomics reduces wasted effort in drug discovery.
Professional Diploma in
Bioinformatics and Metabolomics
Build real-world skills in bioinformatics and metabolomics used across healthcare, pharma, and life sciences. Learn to analyze multi-omics data, identify biomarkers, and translate complex biological data into actionable insights using modern analytical pipelines.
Functional genomics is applied wherever understanding biological activity matters more than simply knowing which genes exist. In healthcare, this shift has transformed how diseases are detected, classified, treated, and studied over time.
Early Disease Detection
Many diseases begin with molecular changes long before symptoms appear. Functional genomics helps detect these early signals by identifying abnormal patterns of gene activity and pathway disruption.
In cancers, altered gene expression can signal tumor development before it becomes visible on scans. In neurological conditions such as Alzheimer’s or Parkinson’s disease, early disruptions in neuronal signaling and metabolic pathways can be detected years before clinical diagnosis.
By detecting abnormal gene activity before symptoms appear, functional genomics strengthens molecular diagnostics and enables earlier, more accurate intervention.
Case Study: Gastric Cancer Drug Synergy Explained by Gene Function
Aspect
Details
The Problem
Gastric cancer is highly resistant to chemotherapy, and many drug combinations fail despite targeting known pathways.
What Functional Genomics Revealed
Screening revealed that a drug combination worked because one drug blocked the cancer cell’s drug-efflux mechanism.
What Changed Because of It
Researchers understood why the combination worked and identified patients most likely to benefit.
Why This Case Matters
Functional genomics revealed what drugs were actually doing inside cells.
Personalized Treatment Planning
Patients with the same diagnosis often respond differently to the same treatment. Functional genomics explains this by revealing how active disease-related pathways are in individual patients.
In oncology, functional profiling identifies whether tumors are driven by growth signaling, immune evasion, or metabolic changes. In autoimmune diseases, it distinguishes inflammatory patterns that appear similar clinically but require different therapies.
By aligning treatment choices with biological behavior rather than labels, functional genomics reduces trial-and-error medicine.
Disease Subtyping and Risk Stratification
Many diseases that appear identical under standard testing are biologically different at the molecular level. Functional genomics enables disease subtyping based on gene activity rather than symptoms alone.
This is especially important in cancers, blood disorders, and neurological diseases, where molecular subtypes predict aggressiveness, recurrence risk, and long-term outcomes.
Drug Target Discovery and Validation
Targeting the wrong biological signal leads to failed therapies. Functional genomics helps identify which genes and pathways are actually driving disease.
By studying gene activity and pathway behavior, researchers validate whether targets play a causal role in disease progression. This improves target selection and reduces late-stage drug failures.
Understanding Rare and Undiagnosed Disorders
Rare genetic disorders often remain unexplained even after DNA sequencing. Functional genomics bridges this gap by showing how genetic changes disrupt biological pathways.
In inherited metabolic disorders, neuromuscular diseases, and rare epileptic syndromes, functional analysis clarifies whether a variant is harmful and how it affects the body.
Predicting Treatment Response and Resistance
Functional genomics predicts how patients respond to therapies by studying gene activity linked to drug metabolism, signaling pathways, and resistance mechanisms.
In cancer treatment, it explains why resistance develops and guides alternative strategies before disease progression worsens.
Case Study: Diagnosing Rare Diseases with RNA-Based Functional Genomics
Aspect
Details
The Problem
Many rare disease patients remain undiagnosed even after DNA sequencing.
What Functional Genomics Revealed
RNA sequencing showed how variants affected gene expression and splicing.
What Changed Because of It
Diagnostic accuracy improved for patients with no prior answers.
Why This Case Matters
Functional genomics turns uncertain genetic data into diagnoses.
Monitoring Disease Progression and Treatment Effectiveness
Functional genomics is used to track how diseases evolve over time. Changes in gene expression can indicate whether a disease is progressing, stabilizing, or responding to therapy.
This allows clinicians to adjust treatment plans based on biological response rather than waiting for symptoms or imaging changes.
Beyond One-Time Testing
Functional genomics is increasingly used for continuous monitoring by tracking changes in biological activity over time. This supports dynamic care decisions based on molecular response rather than delayed clinical signs.
Supporting Systems Biology and Integrated Care
Functional genomics aligns with systems biology by integrating gene activity with broader biological networks. Instead of viewing genes in isolation, it models how genes, proteins, and pathways interact within the body.
This systems-level understanding supports more comprehensive disease models and improves how complex conditions are diagnosed and managed across healthcare settings.
Conclusion
Functional genomics has reshaped how healthcare understands disease. Instead of relying only on DNA sequences, it focuses on how genes behave in real biological conditions, helping explain differences in disease progression, treatment response, and clinical outcomes.
As medicine becomes more personalized and data-driven, understanding gene activity and biological pathways is no longer optional across healthcare and life sciences. Functional genomics now sits at the core of modern diagnosis, research, and drug development.
From a career perspective, this shift has created growing demand for professionals who can interpret functional genomic data in clinical research, molecular diagnostics, bioinformatics, and precision medicine roles.
At CliniLaunch, we help learners build this foundation through healthcare and life sciences programs aligned with real-world clinical and research needs. Functional genomics is not just an emerging concept—it reflects how modern medicine now approaches disease, through function rather than sequence.
Frequently Asked Questions (FAQs)
FAQs
1. How is functional genomics used in everyday clinical decision-making?
Functional genomics informs how diseases are classified, which diagnostic tests are ordered, and how treatments are prioritized by revealing pathway activity and gene expression patterns rather than relying only on DNA variants.
It supports oncologists, neurologists, and immunologists in choosing therapies that align with a patient’s real-time disease biology instead of static genetic risk alone.
2. What role does functional genomics play in molecular diagnostics and early disease detection?
Functional genomics enhances molecular diagnostics by detecting abnormal gene expression and pathway disruptions before symptoms or imaging changes appear.
This enables earlier risk assessment, more accurate disease classification, and improved use of tools such as RNA-seq–based panels and multi-omics signatures in cancer, neurological, and autoimmune conditions.
3. How does functional genomics support drug discovery, target validation, and biomarker discovery?
In drug discovery, functional genomics confirms which genes and pathways actually drive disease, reducing the risk of pursuing non-causal targets.
It also accelerates biomarker discovery by linking gene activity patterns with treatment response, resistance, and disease progression, leading to more efficient and better-stratified clinical trials.
4. What skills and careers are emerging around functional genomics in healthcare?
Emerging roles include bioinformatics analyst, multi-omics data scientist, clinical genomics researcher, and molecular diagnostics specialist.
Professionals in these roles require skills in genomic data analysis, systems biology, biomarker discovery, and AI-enabled interpretation of high-throughput biological data to translate functional genomics into clinical and pharmaceutical decisions.
5. How are AI and data science changing functional genomics in modern healthcare?
AI and data science are used to analyze large functional genomics datasets, identify complex gene expression patterns, and predict treatment response or resistance.
These approaches integrate genomics, transcriptomics, proteomics, and metabolomics into practical tools for precision medicine, clinical research, and hospital-level decision support by automating variant interpretation, risk prediction, and drug response modeling.
Clinical research careers are no longer limited to labs or paperwork. They support how new medicines, vaccines, and medical devices are tested before reaching patients. Every approved treatment goes through clinical studies, making this field a vital part of modern healthcare.
By 2026, clinical research has become more global, digital, and data-driven. Trials now run across countries, use online systems instead of paper, and collect data from hospitals, labs, and real-world patient sources. Because of this shift, the industry needs professionals who understand how trials actually work, how data is handled safely, and how regulatory standards are followed in practice.
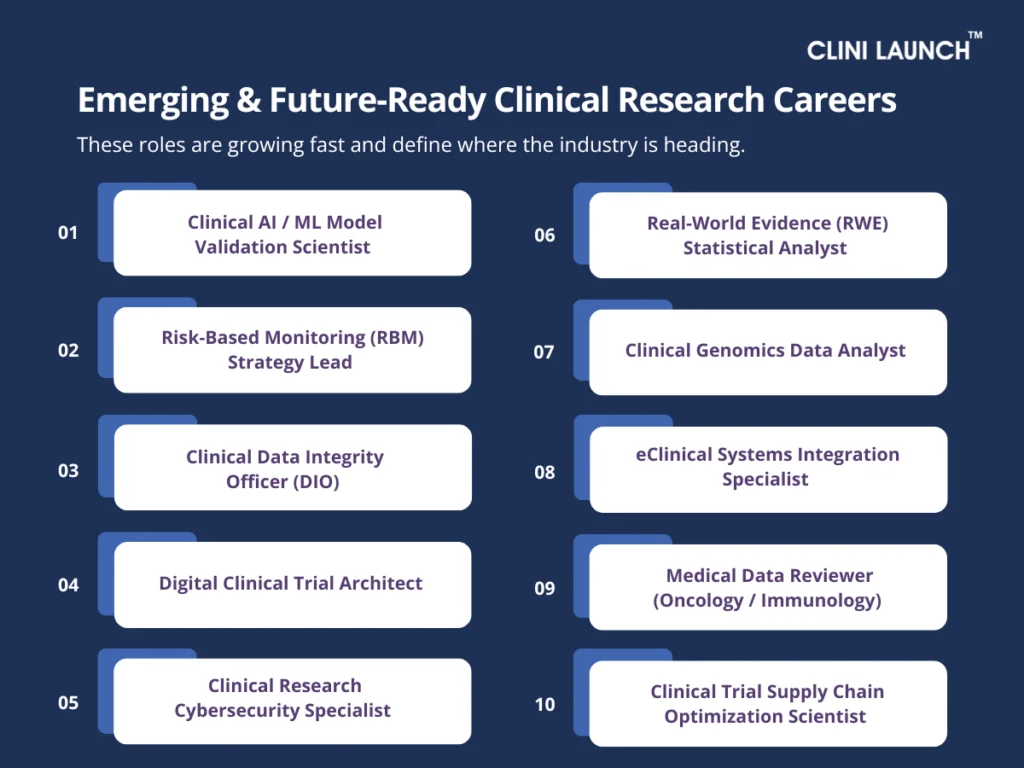
As the industry evolves, clinical research career paths have also expanded. Some roles are already well-established and in high demand today, forming the core of clinical trial operations. At the same time, new roles are emerging that combine clinical research with technology, analytics, and digital systems.
Clinical research jobs are not a single job anymore, but a connected career ecosystem. To make this easier to understand, this guide is divided into two parts: high-demand clinical research careers that are actively hiring, and emerging roles that reflect where the industry is heading. For beginners, this approach helps clarify where to start and how career paths can grow over time.
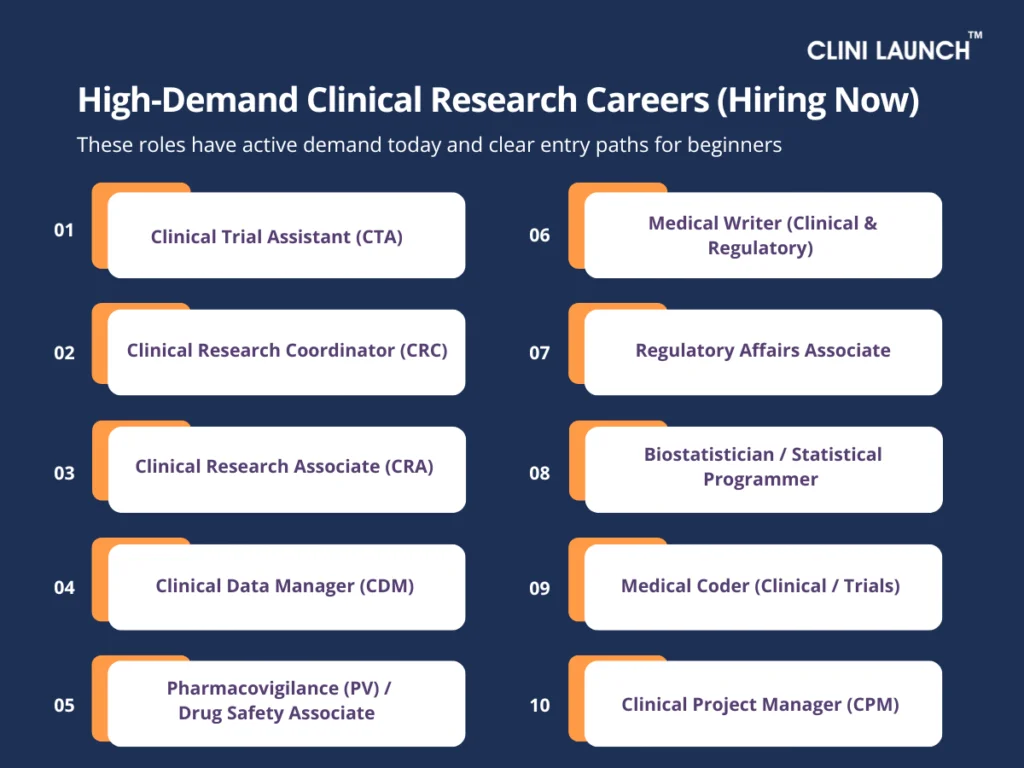
Top 10 High-Demand Careers in Clinical Research
Clinical Research Associate (CRA)
A Clinical Research Associate (CRA) ensures that clinical trials are conducted correctly. While scientists design studies and doctors treat patients, CRAs make sure every step of the trial follows the approved plan and global guidelines. As clinical trials expand worldwide and India grows as a key research hub, this role has become one of the most in-demand careers in clinical research.
For beginners, the CRA role offers early exposure to how real clinical studies run in hospitals and research centers. It is often the first role where professionals see the full trial process, from reviewing patient data to supporting regulatory compliance.
What a CRA Does
CRAs work closely with research sites to review patient records, check trial documents, and confirm that study procedures are followed correctly. They coordinate with investigators, site teams, and sponsors to keep studies organized, compliant, and inspection-ready. Over time, CRAs gain exposure to different therapeutic areas such as oncology and cardiology.
Clinical Research Associate (CRA) — Salary, Scope, Skills & Role Fit Snapshot
Category
Details
Average Salary (India)
₹4.5 – ₹8 LPA for entry-level roles; increases with monitoring experience
Senior / Lead CRA Salary
₹12 – ₹20 LPA in India; global roles can exceed ₹90 Lakh per year
Growth Outlook (Next 5 Years)
~30% growth driven by increasing trial volumes and digital monitoring
Key Skills Gained
Clinical monitoring, protocol compliance, source data verification, stakeholder communication, attention to detail
Career Progression
Lead CRA, Clinical Trial Manager (CTM), Clinical Project Manager (CPM), QA Auditor, Regulatory or PV roles
Who This Role Fits Best
Beginners who want hands-on exposure to trial execution, are comfortable with structured processes, and want strong global career mobility
Key Benefits
Global demand, exposure to advanced therapies, strong career mobility, performance-based incentives
Why This Role Matters
Builds deep clinical operations knowledge and opens multiple long-term career paths
PG DIPLOMA IN
Clinical Research
Master the detailed processes involved in designing, conducting, monitoring, and managing clinical trials. This program equips you with expertise in ethical, regulatory, and scientific aspects of research, preparing you for senior roles in pharmaceutical companies and CROs.
A Clinical Research Coordinator (CRC) works at hospitals and research sites where clinical trials are conducted. While sponsors and CROs manage studies at a higher level, CRCs handle the day-to-day activities that keep trials running smoothly at the site.
For beginners, the CRC role offers direct exposure to real clinical environments. It is often the first role where professionals interact with patients, investigators, and clinical trial protocols in a practical setting.
Why This Role Exists
Clinical trials depend heavily on accurate execution at the hospital or research site. Patient visits, data collection, and documentation must be done correctly and on time. CRCs exist to ensure that these activities are carried out as per the study protocol and ethical requirements. They help maintain consistency, accuracy, and patient safety at the site level, which is essential for successful trials.
What a CRC Does
CRCs coordinate daily trial activities at the research site. They assist with patient screening and enrollment, schedule study visits, collect trial data, and maintain study documents. They work closely with investigators, nurses, and CRAs to ensure smooth communication and proper documentation.
Clinical Research Coordinator (CRC) — Salary, Scope, Skills & Role Fit Snapshot
Category
Details
Average Salary (India)
₹2.5 – ₹4.5 LPA for entry-level roles; rises with site experience
Senior / Lead CRC Salary
₹5 – ₹8 LPA in India; global site roles can reach ₹50–60 Lakh per year
Growth Outlook (Next 5 Years)
25–30% growth due to increasing site-based trials
Key Skills Gained
Patient coordination, site documentation, protocol execution, clinical communication
Career Progression
CRA, Site Manager, Clinical Trial Manager, Project Coordinator
Clinical Data Manager (CDM)
A Clinical Data Manager ensures that data collected during clinical trials is accurate, complete, and ready for analysis. While trial teams focus on patients and site activities, CDMs manage the data systems that turn trial information into reliable evidence.
For beginners, the CDM role offers a structured, system-driven entry into clinical research. It is well suited for those who prefer working with data and digital tools rather than patient-facing or site-based work.
Why This Role Exists
Clinical trials generate large volumes of data from multiple sites and sources. This data must be clean, consistent, and traceable before it can be analyzed or submitted to regulators. CDMs exist to ensure data quality and integrity throughout the study. They play a critical role in making sure trial results are trustworthy and usable for scientific and regulatory decisions.
What a CDM Does
CDMs design and manage data collection systems, review trial data for errors, and resolve discrepancies with study teams. They work closely with CRAs, statisticians, programmers, and clinical teams.
Clinical Data Manager (CDM) — Salary, Scope, Skills & Role Fit Snapshot
Category
Details
Average Salary (India)
₹4 – ₹7 LPA for entry-level roles; increases with EDC experience
Senior / Lead CDM Salary
₹12 – ₹18 LPA in India; global roles can reach ₹80 Lakh–₹1 Cr per year
Growth Outlook (Next 5 Years)
30%+ growth driven by digital trials and data-driven research
Key Skills Gained
Data quality management, EDC systems, discrepancy resolution, data standards, analytical thinking
Career Progression
Lead CDM, Data Quality Manager, Clinical Database Designer, Biostatistics, Clinical Analytics
Who This Role Fits Best
Beginners who prefer data-focused work, structured systems, and minimal site or patient interaction
Key Benefits
Strong career stability, global relevance, high demand for technical expertise
Why This Role Matters
Ensures trial data is reliable for scientific and regulatory decisions
Pharmacovigilance (PV) Associate / Drug Safety Associate
A Pharmacovigilance (PV) Associate, also known as a Drug Safety Associate, focuses on monitoring the safety of medicines during clinical trials and after they are approved. While clinical teams study how well a drug works, PV professionals ensure that any side effects are identified, documented, and reported correctly.
For beginners, this role offers a clear and stable entry to pharmacovigilance careers. It is well suited for those who prefer structured processes and want to work in roles directly connected to patient safety.
Why This Role Exists
No medicine is completely risk-free. As drugs are tested and later used by larger patient populations, safety information continues to emerge. PV roles exist to track this information and ensure that potential risks are understood and communicated.
What a PV Associate Does
PV Associates review safety reports from clinical trials, healthcare professionals, and patients. They document adverse events, code medical terms using standard systems, and ensure reports are submitted to regulatory authorities on time.
Pharmacovigilance (PV) Associate — Salary, Scope, Skills & Role Fit Snapshot
Category
Details
Average Salary (India)
₹3 – ₹5 LPA for entry-level roles; increases with safety case experience
Senior / Specialist Salary
₹6 – ₹12 LPA in India; global PV roles can exceed ₹70–80 Lakh per year
Growth Outlook (Next 5 Years)
25–35% growth driven by post-marketing surveillance and global compliance
Key Skills Gained
Adverse event analysis, medical terminology, regulatory compliance, safety documentation
Career Progression
Safety Specialist, Aggregate Report Writer, Signal Detection Analyst, Medical Writing, Regulatory roles
Who This Role Fits Best
Beginners who want to work in drug safety, prefer structured workflows over site travel, and are comfortable reviewing medical information and safety data
Key Benefits
Strong job stability, continuous global demand, specialization opportunities
Why This Role Matters
Direct impact on patient safety across the entire drug lifecycle
Advanced Diploma in
AI in Drug Safety & Compliance
Gain in-depth expertise in pharmacovigilance, regulatory reporting, and risk management across the drug lifecycle, enhanced by the integration of Artificial Intelligence tools.
A Medical Writer (Clinical & Regulatory) creates the documents required to run, evaluate, and approve clinical trials. While clinical teams generate data, medical writers turn that information into clear, structured documents.
This role combines scientific understanding with communication skills and does not require site travel or patient-facing work.
Why This Role Exists
Regulators cannot evaluate a drug unless clinical data is presented clearly and accurately. Medical writers ensure trial documentation meets global regulatory standards.
What a Medical Writer Does
Medical Writers develop documents such as clinical trial protocols, investigator brochures, informed consent forms, clinical study reports (CSRs), and regulatory submission dossiers. They interpret clinical and statistical outputs and ensure consistency with international guidelines. They work closely with clinical operations, biostatistics, pharmacovigilance, and regulatory teams to align scientific content with regulatory expectations across different regions. Over time, this role provides exposure to multiple therapeutic areas and global submission pathways.
Medical Writer (Clinical & Regulatory) — Salary, Scope, Skills & Role Fit Snapshot
Category
Details
Average Salary (India)
₹4 – ₹7 LPA for entry-level writers; increases with document complexity and experience
Senior / Specialist Salary
₹10 – ₹18 LPA in India; international roles can exceed ₹80 Lakh–₹1 Cr per year
Growth Outlook (Next 5 Years)
30%+ growth driven by increasing global trials and regulatory submissions
Key Skills Gained
Scientific writing, data interpretation, regulatory documentation, guideline compliance, attention to detail
Career Progression
Senior Medical Writer, Scientific Writer, Regulatory Strategist, Medical Affairs, Publications roles
Who This Role Fits Best
Beginners who enjoy writing, are comfortable interpreting scientific data, and prefer desk-based roles over site or patient work
Key Benefits
Strong global demand, remote-work opportunities, blend of science and communication
Why This Role Matters
Enables regulatory approvals by translating clinical data into compliant, decision-ready documents
Regulatory Affairs Associate
A Regulatory Affairs (RA) Associate ensures that clinical trials and medical products meet all regulatory requirements before and after approval.
This role offers a clear entry into the compliance and approval side of clinical research.
Why This Role Exists
Every drug or medical device must be reviewed and approved by regulatory authorities. Regulatory Affairs ensures compliance throughout the product lifecycle.
What a Regulatory Affairs Associate Does
Regulatory Affairs Associates support the preparation and submission of regulatory documents for clinical trials and approvals. They coordinate with clinical, safety, manufacturing, and quality teams to compile dossiers and respond to regulatory queries. They also track regulatory changes, support labeling updates, and assist with post-approval activities. Over time, this role provides strong exposure to global regulatory frameworks and approval pathways.
Regulatory Affairs Associate — Salary, Scope, Skills & Role Fit Snapshot
Category
Details
Average Salary (India)
₹3.5 – ₹6 LPA for entry-level roles; increases with submission experience
Senior / Specialist Salary
₹8 – ₹15 LPA in India; global roles can exceed ₹70–90 Lakh per year
Growth Outlook (Next 5 Years)
25–35% growth driven by new drug approvals, biosimilars, and evolving regulations
Beginners who prefer structured, rule-driven work and want to be involved in product approvals rather than site activities
Key Benefits
Long-term career stability, global relevance, involvement in product launch pathways
Why This Role Matters
Enables safe and timely market access by ensuring regulatory compliance
Biostatistician / Statistical Programmer
A Biostatistician or Statistical Programmer works with clinical trial data to determine whether a treatment is safe and effective. While trials generate large amounts of data, these professionals turn that data into meaningful results that support scientific conclusions and regulatory decisions.
For beginners with a strong interest in numbers, logic, and data analysis, this role offers a high-impact entry into clinical research. It is well suited for those who prefer analytical work over site-based or patient-facing roles.
Why This Role Exists
Clinical trial data must be analyzed correctly to prove that a treatment works and is safe. Regulators rely heavily on statistical evidence when approving new drugs. Biostatisticians and statistical programmers exist to ensure analyses are accurate, reproducible, and compliant with global standards. Their work directly influences study outcomes, approvals, and scientific credibility.
What a Biostatistician / Statistical Programmer Does
Biostatisticians design statistical analysis plans, select appropriate methods, and interpret trial results. Statistical programmers prepare analysis-ready datasets, generate tables, figures, and listings, and ensure data follows regulatory standards. They work closely with clinical teams, medical writers, and regulatory groups to support submissions and publications. Over time, this role provides deep exposure to clinical data, trial design, and advanced analytics.
Biostatistician / Statistical Programmer — Salary, Scope, Skills & Role Fit Snapshot
Category
Details
Average Salary (India)
₹5 – ₹9 LPA for entry-level roles; increases with statistical and CDISC expertise
Senior / Lead Salary
₹15 – ₹25 LPA in India; global roles can exceed ₹1 Cr per year
Growth Outlook (Next 5 Years)
30%+ growth driven by digital trials, complex datasets, and advanced analytics
Key Skills Gained
Statistical analysis, programming (SAS/R/Python), data modeling, regulatory data standards
Career Progression
Lead Statistician, Statistical Team Manager, Clinical Data Science, AI-driven analytics roles
Who This Role Fits Best
Beginners who enjoy mathematics, programming, and structured problem-solving over site or patient work
Key Benefits
High earning potential, strong global mobility, exposure to advanced analytics
Why This Role Matters
Provides the statistical evidence required for regulatory approvals and clinical decisions
PG DIPLOMA IN
Biostatistics
Master the development and application of statistical methods to health data, enabling you to analyze complex biomedical and public health information. This course is for professionals seeking rewarding careers in healthcare data analysis and research.
Advanced Biostatistical Modeling, Survival Analytics, Epidemiological Data Analysis, Data Visualization Techniques, and Proficiency in Statistical Software (R/SAS) ..
A CTA supports clinical trial teams by handling documentation, coordination, and operational tasks that keep studies running smoothly. While CRAs and project managers oversee trial execution, CTAs esnsure that records, trackers, and communications stay organized and up to date. For beginners, this role is one of the most common entry points into clinical research. It offers early exposure to how trials are managed across sponsors, CROs, and research sites, without requiring prior field experience.
Why This Role Exists
Clinical trials involve large volumes of documents, timelines, and coordination across teams. Missing or outdated records can delay studies or create compliance risks. The CTA role exists to keep trial operations organized and audit-ready. CTAs form the operational backbone of clinical teams, ensuring that workflows remain structured and reliable.
What a CTA Does
CTAs support trial teams by maintaining the Trial Master File (TMF), tracking study activities, coordinating meetings, and assisting with site start-up tasks. They work closely with CRAs, project managers, regulatory teams, and site staff to ensure documentation is complete and compliant. Over time, this role provides broad visibility into all stages of a clinical trial, from start-up to close-out.
Clinical Trial Assistant (CTA) — Salary, Scope, Skills & Role Fit Snapshot
Category
Details
Average Salary (India)
₹2.5 – ₹4 LPA for entry-level roles; increases with documentation and system experience
Senior / Lead Salary
₹5 – ₹8 LPA in India; global CTA/Specialist roles can reach ₹40–50 Lakh per year
Growth Outlook (Next 5 Years)
20–30% growth driven by global outsourcing and digital trial operations
Key Skills Gained
Clinical documentation, trial coordination, TMF management, process organization
Career Progression
CRA, Study Coordinator, Clinical Operations Specialist, Project Manager roles
Who This Role Fits Best
Beginners who want a structured entry into clinical research, prefer organized desk-based work, and want exposure to multiple trial functions
Key Benefits
Strong entry-level opportunity, broad clinical operations exposure, clear career ladder
Why This Role Matters
Keeps trials organized, compliant, and operationally efficient from start to finish
Medical Coder (Clinical Trials / Healthcare)
A Medical Coder converts clinical information into standardized medical codes used across healthcare and clinical research. While doctors and trial teams generate clinical data, coders ensure that this information is recorded accurately and consistently using global coding systems. For beginners, this role offers a clear and stable entry into healthcare and clinical research. It is especially suitable for those who prefer detail-oriented, desk-based work rather than site visits or patient interaction.
Why This Role Exists
Clinical trials and healthcare systems generate vast amounts of medical data. Without standardized coding, this data cannot be analyzed, shared, or reviewed reliably. Medical coders exist to ensure consistency, accuracy, and compliance across clinical data, safety reporting, and regulatory submissions. Accurate coding directly impacts data quality, patient safety analysis, and regulatory outcomes.
What a Medical Coder Does
Medical Coders review clinical documents such as diagnoses, procedures, lab results, medical histories, and adverse event reports. They convert this information into standardized codes using systems like ICD, CPT, SNOMED CT, and MedDRA. They work closely with clinical operations, safety teams, data management, and regulatory groups to ensure data is correctly classified and compliant. Over time, this role provides strong exposure to medical terminology, clinical workflows, and global data standards.
Medical Coder (Clinical Trials / Healthcare) — Salary, Scope, Skills & Role Fit Snapshot
Category
Details
Average Salary (India)
₹2.5 – ₹4.5 LPA for entry-level roles; increases with coding expertise
Senior / Specialist Salary
₹5 – ₹10 LPA in India; global roles can exceed ₹40–60 Lakh per year
Growth Outlook (Next 5 Years)
25–35% growth driven by digital health records, outsourcing, and trial volume
Key Skills Gained
Medical coding, medical terminology, data accuracy, compliance awareness
Career Progression
Quality Analyst, Coding Auditor, Clinical Data Reviewer, Safety Coding Specialist, CDM or PV roles
Who This Role Fits Best
Beginners who prefer detail-focused work, are comfortable reviewing medical records, and want a stable, non-site-based healthcare role
Key Benefits
High job stability, global demand, remote-work opportunities
Why This Role Matters
Ensures clinical data is accurate, consistent, and usable for research and safety decisions
Advanced Diploma in
Medical Coding
Learn to transform complex healthcare data into universal alphanumeric codes for diagnoses and procedures. This training provides comprehensive knowledge of medical terminology, anatomy, and coding systems to prepare you for industry certification (CPC/CCS).
Salary figures mentioned in this article are derived from consolidated insights across Glassdoor, AmbitionBox, PayScale, Indeed India, LinkedIn Jobs, and verified industry hiring patterns from clinical research organizations (CROs), pharmaceutical companies, and biotech sponsors.
Salary ranges are indicative and may differ based on skill depth, years of experience, geographic location, therapeutic expertise, and global project exposure.
Emerging and Future-Ready Careers in Clinical Research
Clinical Research Cybersecurity Specialist
As clinical trials move online using cloud systems, remote tools, and wearable devices, keeping patient data safe has become critical. This role focuses on protecting trial systems from data leaks, cyberattacks, and misuse while ensuring digital platforms meet privacy and regulatory rules. Demand is growing because modern trials rely on many connected systems and regulators now closely review how data is stored and shared. People in this role usually come from IT security or clinical technology backgrounds and help ensure trials run safely without digital disruptions.
Quick Summary
Aspect
Snapshot
Why this role exists
Clinical trials now run on digital systems that handle sensitive patient data
Master core clinical research principles combined with cutting-edge expertise in data security, cloud technology, and digital compliance. This program prepares you to secure data integrity and optimize digital workflows in clinical trials.
Cybersecurity in Healthcare Systems, Cloud Computing for Trials, Data Privacy & Compliance (HIPAA/GDPR), Clinical Data Management, and Risk-Based Monitoring
As AI tools are increasingly used in clinical trials for patient selection, imaging analysis, and safety monitoring, someone must ensure these models are accurate, unbiased, and safe to use. This role exists to test and validate AI models before they influence clinical or regulatory decisions. Demand is rising because regulators now require transparency and proof that AI systems behave reliably across different patient groups. Professionals in this role usually come from data science, biostatistics, or clinical programming backgrounds and work at the intersection of AI, clinical data, and regulation.
Quick Summary
Aspect
Snapshot
Why this role exists
AI models must be validated before regulators accept their outputs
Core focus
Testing AI accuracy, bias, reliability, and reproducibility
What’s driving demand
AI adoption in trials + regulatory scrutiny
Who this role is for
Data scientists, statisticians, ML engineers
Career nature
Specialist, high-impact, regulatory-facing
Future relevance
Will grow as AI becomes embedded in trials
Clinical Data Integrity Officer (DIO)
Modern clinical trials rely on digital systems rather than paper, which makes data accuracy and traceability more complex. This role exists to ensure that clinical data remains complete, reliable, and compliant across all digital systems used in a trial. Demand is increasing because regulators now closely examine audit trails, system validations, and data integrity during inspections. Professionals typically move into this role from data management, quality assurance, or compliance and act as guardians of trust in digital trials.
Quick Summary
Aspect
Snapshot
Why this role exists
Digital trials create higher data integrity risks
Core focus
Data accuracy, traceability, audit readiness
What’s driving demand
Regulatory focus on ALCOA+ and digital systems
Who this role is for
CDM, QA, compliance professionals
Career nature
Governance and oversight role
Future relevance
Will become standard in digital trials
Risk-Based Monitoring (RBM) Strategy Lead
Traditional on-site monitoring is no longer efficient for large, global clinical trials. This role focuses on designing smarter monitoring strategies using data and risk indicators to identify issues early. Demand exists because regulators now expect risk-based approaches instead of blanket site visits. Professionals usually reach this role after experience as CRAs or clinical operations leads and influence how trials are monitored globally.
Oncology and immunology trials generate complex data that automated systems cannot fully interpret. This role exists to medically review trial data and identify meaningful clinical patterns, safety concerns, or inconsistencies. Demand is growing because precision medicine trials require deeper medical judgment. Professionals in this role are typically clinicians or experienced clinical scientists working closely with safety and clinical teams.
Aspect
Snapshot
Why this role exists
Complex data needs expert medical interpretation
Core focus
Medical review of trial and biomarker data
What’s driving demand
Growth in oncology and immunotherapy
Who this role is for
Clinicians, clinical scientists
Career nature
Highly specialized medical role
Future relevance
Critical in precision medicine trials
Digital Clinical Trial Architect (DCT Architect)
As trials move toward decentralized and hybrid models, someone must design how all digital tools work together. This role focuses on building and aligning systems like eConsent, ePRO, telemedicine, wearables, and EDC into a single trial workflow. Demand exists because poorly designed digital trials increase errors and site burden. Professionals often come from clinical operations or eClinical system backgrounds and shape the digital backbone of modern trials.
Quick Summary
Aspect
Snapshot
Why this role exists
Digital tools must work as one system
Core focus
Designing end-to-end digital trial workflows
What’s driving demand
Decentralized and hybrid trials
Who this role is for
Clinical ops, eClinical experts
Career nature
Strategy + technology role
Future relevance
Will define how trials are built
Genomics & Precision Medicine Analyst
Clinical Genomics Data Analyst
Many modern trials depend on genomic and biomarker data to select patients and measure response. This role exists to analyze and interpret genomic data within a clinical trial context. Demand is rising due to precision medicine and biomarker-driven studies. Professionals usually come from bioinformatics or genomics backgrounds and work closely with clinical and translational research teams.
Quick Summary
Aspect
Snapshot
Why this role exists
Genomic data drives modern trials
Core focus
Interpreting sequencing and biomarker data
Who this role is for
Precision oncology and rare disease research
Future relevance
Bioinformaticians, genomics analysts
Real-World Evidence (RWE) Statistician
Clinical trials alone no longer provide enough evidence. This role focuses on analyzing real-world data from healthcare systems to understand how treatments perform outside controlled trials. Demand is growing because regulators increasingly accept real-world evidence for approvals and safety monitoring. Professionals typically come from biostatistics or epidemiology backgrounds.
Quick Summary
Aspect
Snapshot
Why this role exists
Regulators demand post-approval effectiveness data
Clinical trials depend on timely delivery of investigational products, especially for biologics and personalized therapies. This role uses data and forecasting to prevent shortages and waste. Demand is growing as trials become global and decentralized. Professionals usually come from supply chain or operations research backgrounds.
Quick Summary
Aspect
Snapshot
Why this role exists
Supply failures delay trials
Core focus
Forecasting and supply optimization
What’s driving demand
Complex therapies and global trials
Who this role is for
Supply chain, analytics professionals
Career nature
Operational and analytical
Future relevance
Increasingly important in advanced trials
Conclusion:
Clinical research today offers two clear career paths: roles that are in high demand right now and roles that are shaping how trials will be run in the future. Core positions such as Clinical Research Associate, Clinical Data Manager, Pharmacovigilance Associate, Medical Writer, Regulatory Affairs, and Clinical Trial Assistant continue to form the backbone of clinical operations. At the same time, digital trials, AI adoption, real-world data, genomics, and decentralized models are creating newer, specialized roles that require deeper technical and system-level expertise.
Together, these roles reflect how the industry is evolving—from execution-focused trial management to data-driven, technology-enabled research. For learners and professionals, this means there is no single “right” entry point. Some careers begin in core clinical roles and grow into leadership or specialization, while others transition directly into advanced digital and analytics-driven positions.
CliniLaunch Research Institute supports both paths through its range of healthcare and life sciences programs. Whether you are starting with foundational clinical roles or preparing for emerging digital and data-centric careers, CliniLaunch provides industry-aligned training, practical exposure, and expert guidance to help you build skills that matter.
Clinical research will keep changing. Those who build strong foundations and adapt to new demands will shape its future—rather than struggle to keep up with it.
Frequently Asked Questions (FAQs)
Which clinical research career is best for beginners?
Roles like Clinical Trial Assistant (CTA), Clinical Research Coordinator (CRC), and Pharmacovigilance Associate are considered ideal entry points. They provide structured exposure to trial processes and strong learning opportunities.
Is clinical research a good career in India?
Yes. India continues to be a global hub for clinical trials, data management, pharmacovigilance, and regulatory operations, offering strong domestic and international career opportunities.
Do clinical research jobs require a medical degree?
No. While some roles benefit from medical knowledge, most clinical research positions are open to life sciences, pharmacy, biotechnology, nursing, and even data science graduates.
Which clinical research role has the highest salary?
Senior roles in biostatistics, AI/ML validation, global regulatory affairs, and clinical project management typically command the highest salaries.
How can I start a career in clinical research?
Start by understanding core clinical trial processes, regulatory guidelines, and selecting a specialization. Structured diploma or postgraduate programs aligned with industry requirements can help accelerate entry into the field.
Today, R programming in healthcare has become a foundational skill for analyzing complex medical data, supporting clinical research, and enabling evidence-based decisions. From hospitals to research labs, R programming in healthcare is increasingly used to turn raw data into reliable insights that improve patient outcomes.
When it comes to analyzing medical data, visualizing gene activity, or predicting trends, R programming is one of the most powerful tools available in healthcare today. R isn’t just about basic statistics it’s about unlocking insights from vast datasets with ease.
With a vast library of statistical functions and specialized healthcare tools, R empowers healthcare professionals to perform advanced analysis, generate meaningful visualizations, and uncover patterns that drive decisions.
A widely cited 2015 survey by Rexer Analytics found that 76% of analytics professionals use R. Its ability to handle massive datasets and make evidence-based predictions has made it the go-to tool for transforming raw data into actionable insights. This growing adoption highlights the importance of R programming for modern healthcare professionals who must work with large, complex, and sensitive medical datasets.
Mastering R is essential for healthcare professionals to make data-driven decisions in clinical research, patient care, and biotechnology. Now, let’s explore how R programming is impacting various healthcare areas, from gene analysis to personalized medicine.
Featured Snippet: R programming in healthcare helps professionals analyze clinical data, study disease trends, and support research in genomics, trials, and public health. It is widely used in hospitals, pharma, and research labs for data-driven healthcare decisions.
What Is R Programming in Healthcare?
R programming in healthcare refers to using the R language to analyze and interpret medical, clinical, and biological data. It is widely used in hospitals, research labs, pharma, and public health to work with patient data, clinical trials, and large biomedical datasets.
R is built specifically for statistics and data analysis, making it ideal for tasks like hypothesis testing, outcome analysis, predictive modeling, and data visualization. Its reliability and reproducibility make it a trusted tool for clinical research, regulatory work, and evidence-based healthcare decisions.
Applications of R Programming in Healthcare – How R Programming is Transforming Key Areas of Healthcare and Life Sciences
1 .Gene Expression Analysis
Gene expression analysis looks at which genes are “turned on” or “turned off” in a cell or tissue. Imagine each gene as a factory line producing a product (a protein). Gene expression measures how much product each line is making right now. In experiments, scientists compare two states, for example, tumour vs normal tissue, to find which factory lines are working harder or quieter. The end goal is to find a small list of genes whose changed activity explains the biological difference you care about.
Situation before R Programming
Before R became common, researchers handled gene expression with a messy mix of spreadsheets, separate tools, and manual steps. Labs produced raw output from sequencers or microarrays, but turning that into a clean table ready for analysis needed a lot of custom work. Different labs used different methods, so results didn’t always match. People often used one tool for normalization, another for statistics, and another for plotting — moving data between programs by hand. That made the work slow, error-prone, and hard to reproduce. If someone asked “how did you get this result?” there was often no single clear answer.
What changed after integrating R Programming in Gene Expression Analysis
R brought everything into one place: cleaning the data, correcting technical differences between runs, doing the right statistics for count-based gene data, drawing clear figures, and making a single reproducible report. Specialized R packages were created by genomics researchers for genomics problems, so common tasks like normalizing read counts or testing thousands of genes at once became straightforward and statistically sound. Instead of juggling files and tools, scientists could write one script that read the raw data, ran the analysis, and produced the figures and written report and anyone else could run the same script and get the same results. That made experiments faster, more reliable, and easier to trust.
Why this matters?
For students, this is practical: learning R means you can move from raw biological data to trustworthy conclusions. If you want to work in a lab, biotech, hospital research, or drug discovery, employers expect you to be able to clean data, check if results are real or noise, and create clear plots and reports that clinicians and researchers can rely on. Knowing the R workflow also teaches you good scientific habits, reproducibility, transparent methods, and careful statistical thinking, which are valued across research and clinical teams. In short, R turns pile-of-files biology into reproducible evidence you can act on.
R Programming Tools Used in Gene Expression Analysis:
Process Stage
R Tools / Packages
What the Tools Do
Data Cleaning & Preparation
dplyr, tidyr, data.table
• Clean and filter gene tables • Handle missing values & inconsistent formats • Reshape data (wide ↔ long) • Process large RNA-seq matrices fast
Differential Expression Analysis
DESeq2, edgeR, limma
• Identify up/down-regulated genes • Normalize gene counts • Compute fold changes & p-values • Compare disease vs control groups
Case Insight: Colorectal Cancer Research Using R In a recent study on colorectal cancer, researchers analyzed RNA-Seq data from cancerous and healthy tissues to find genes that could serve as biomarkers for early detection. Using R, they processed the data and identified 1,641 differentially expressed genes that played key roles in various signaling pathways. Among these, genes like MMP7, TCF21, and VEGFD stood out as promising candidates for diagnosing colorectal cancer. By pinpointing these biomarkers, the study opens the door to earlier detection methods, which could significantly improve patient outcomes. Early diagnosis in cancer is crucial, and this R-powered analysis brings us one step closer to better, more accurate diagnostic tools.
In short, R programming in healthcare turns complex biological data into reproducible evidence that researchers and clinicians can trust.
2. Clinical Trial Data Analysis
Clinical trial data analysis is the process of checking whether a new drug or treatment actually works and whether it is safe. Every patient in a trial generates information, symptoms, lab values, side effects, responses to treatment, and this information needs to be combined and studied carefully. The goal is to compare groups (such as the drug group vs the placebo group) to see if the treatment truly makes a meaningful difference and if any safety concerns appear early. In simple terms, this analysis turns patient records into scientific evidence.
Before R (how teams handled trial data earlier)
Before R became common, trial data was handled through a combination of spreadsheets, manual cleaning, and rigid software like SAS. Much of the work involved fixing errors by hand, adjusting formats, merging patient files, and double-checking details, a slow and repetitive process. Visualizing patterns, such as survival trends or side-effect timelines, often required separate tools or manual charting. Updates were painful: if even one patient’s data changed, analysts had to redo entire parts of the analysis manually. This made the process slow, error-prone, and difficult to reproduce in a transparent way.
How the workflow changed after integrating R Programming in Clinical Research and Trials
R brought flexibility, speed, and transparency into trial analysis. Instead of working with multiple disconnected tools, analysts could clean the data, run statistical tests, create survival curves, compare treatment arms, and generate full reports all within one environment. R automated much of the repetitive work, so when new patient data arrived, the entire analysis, figures, tables, and summaries, could update instantly. It also made results easier to reproduce and share, which is essential in clinical research where every number must be traceable. For modern trials that generate large and complex datasets, R made analysis faster, clearer, and scientifically stronger.
Why this matters to life science and healthcare students
If you want to work in clinical research, pharmacovigilance, or healthcare analytics, you will eventually work with trial data. Understanding how to clean datasets, compare patient outcomes, look for safety patterns, and create simple but meaningful visual summaries is a core skill in this field. R helps you learn these skills in a way that aligns with real industry workflows. It also builds the foundation for roles in CROs, pharma companies, hospitals, and regulatory teams, where the ability to work confidently with trial data is a major advantage. In other words, learning R helps you move from “reading clinical studies” to contributing to them.
R Programming Tools Used in Clinical Trial Data Analysis:
Process Stage
R Tools / Packages
What the Tools Do
Data Cleaning & Preparation
dplyr, tidyr, data.table
• Organize patient datasets into structured formats
Statistical Analysis
survival, survminer, stats, lme4
• Estimate treatment effects with survival models • Compute hazard ratios using Cox models • Analyze longitudinal data with mixed-effects models • Perform hypothesis testing for study endpoints
Visualization & Safety Monitoring
ggplot2, survminer, plotly
• Plot survival curves and event timelines • Visualize dose–response and treatment differences • Create dynamic safety charts for AE patterns • Build interactive visual reviews (plotly dashboards)
Many of these workflows rely on specialized R packages for clinical trials that support survival analysis, safety monitoring, and regulatory reporting.
Case Insight: Analyzing Clinical Trial Data for New Drug Development In a study analyzing clinical trial data for a new cancer drug, researchers used R to evaluate survival rates and side effects in patients. By applying survival analysis techniques such as the Kaplan-Meier estimator and Cox Proportional Hazards model, they gained valuable insights into how the drug performed over time. Visualizations created using ggplot2 helped stakeholders quickly interpret the data, leading to more informed regulatory discussions. The findings, powered by R, not only contributed to the regulatory approval of the drug but also highlighted potential areas for future research, making it a crucial part of the drug development process.
PG DIPLOMA IN
Clinical Research
Build industry-ready skills for clinical trials, regulatory compliance, and drug safety. This program prepares you to work across clinical operations, data management, pharmacovigilance, and regulatory workflows in healthcare and pharma.
Clinical research fundamentals, pharmacology, ethical and regulatory compliance, clinical data management, pharmacovigilance, medical writing, biostatistics basics, clinical SAS fundamentals
Epidemiology is all about understanding how diseases move through a population, who gets infected, how fast it spreads, and what might happen next. During any outbreak, health agencies collect huge amounts of data every day: new cases, tests, deaths, recoveries, and vaccination numbers. But this data almost never arrives clean or consistent. Some places report late, some miss days, and numbers often jump because of festivals, policy changes, or sudden increases in testing.
The challenge before R
Before tools like R were used, epidemiologists relied on spreadsheets and manual calculations to understand what was happening. The problem was simple: daily disease data is noisy and unstable.
Numbers rise one day, fall the next, and often don’t reflect real trends. Because of this, it was extremely difficult to answer basic questions quickly:
Are cases genuinely rising or is it just a reporting delay?
Is the infection slowing down?
Is vaccination making an impact?
Should hospitals prepare for a surge?
This meant decisions were often slower and less confident than they needed to be.
What changed after integrating R Programming in Epidemiology and Public Health
R made epidemiology faster, clearer, and far more responsive.
Instead of struggling with scattered data, R allows analysts to:
clean and organize daily case numbers into proper timelines,
smooth the noise so true trends become visible,
estimate how quickly the disease is spreading,
forecast short-term surges or declines,
and visualize everything through simple, readable graphs.
This ability to turn noisy outbreak data into actionable insights demonstrates the strength of R programming epidemiology in real-world public health decision-making
The biggest advantage? R turns unpredictable, messy outbreak data into something that public-health teams can act on immediately. Hospitals can plan beds, governments can prepare guidelines, and vaccination teams can target the right regions, all because R helps reveal the real pattern behind the confusion.
Why this matters?
Whether you’re studying microbiology, biotechnology, public health, or clinical research, epidemiology is a part of your world. Being able to understand disease patterns is not just useful, it’s becoming a core skill.
Learning R gives you the ability to:
interpret real outbreak data instead of just memorizing theory,
support real-world decisions during public-health crises,
collaborate with epidemiologists, clinicians, and data teams,
and move into careers involving disease surveillance, public health, and healthcare analytics.
R Programming Tools Used in Epidemiological Modeling
Process Stage
R Tools / Packages
What the Tools Do
Data Cleaning & Preparation
dplyr, tidyr, data.table
Organize daily case counts into proper time-series • Fix inconsistent date formats and regional codes • Merge multiple surveillance datasets (district, state, national) • Handle missing or delayed case reporting
Exploratory Trend Analysis
ggplot2, zoo, TTR
• Calculate moving averages and highlight trend shifts • Plot epidemic growth curves and positivity-rate trends • Smooth noisy data to reveal real outbreak patterns
Mathematical Modeling & Forecasting
EpiEstim, epitools, epidemia, forecast
• Estimate reproduction numbers (R₀, Rt) from real-time data • Fit SIR/SEIR models to simulate disease behavior • Generate short-term and long-term outbreak forecasts • Evaluate intervention impact (lockdowns, vaccination boosts)
Model Validation
tidymodels, yardstick
• Compare predicted vs. observed case trends • Measure forecast accuracy using epidemiology metrics • Perform sensitivity tests to see how assumptions affect model results
Visualization & Dashboards
plotly, leaflet, shiny
• Build interactive epidemic dashboards • Display geospatial spread on dynamic maps • Enable real-time exploration of transmission patterns
Case Insight: Modeling COVID-19 Spread Using R During the COVID-19 pandemic, R was instrumental in modeling the spread of the virus. Researchers used R to calculate reproduction numbers (R0) and assess the effectiveness of interventions like lockdowns and vaccination campaigns. This modeling helped predict the future trajectory of the disease, giving governments vital information to manage healthcare resources and implement timely interventions. R’s role in predicting and controlling the spread of COVID-19 demonstrates its power in public health. By enabling data-driven decision-making, R helped shape the global response, ensuring better outcomes for individuals and communities during a time of crisis.
PG DIPLOMA IN
Biostatistics
Build strong statistical foundations for healthcare, clinical research, and life sciences. This program trains you to design studies, analyze biomedical data, apply statistical tests, and interpret results for real research and industry work.
Medical scans look simple on the surface, but anyone who has worked with MRI or CT images knows they’re far from regular pictures. Each scan contains layers of technical information, differences from machine to machine, and subtle patterns that aren’t obvious to the naked eye. For healthcare, the challenge isn’t getting the image, it’s understanding what the image really means.
Before R: When Imaging Relied Almost Entirely on the Human Eye
For years, radiologists examined scans manually, slice by slice. It worked, but it had real limitations:
tiny lesions were easy to miss,
images from different hospitals didn’t behave the same way,
measuring tumors or abnormalities took a huge amount of time,
and quantitative analysis (actual numbers) was nearly impossible without specialized, expensive software.
Imaging was powerful, but the analysis depended too heavily on visual judgment, which limited how deep researchers could go.
After R Programming in Medical Imaging: Turning Scans Into Meaningful, Measurable Insight
R changed imaging by giving researchers a way to treat every image like structured data instead of a flat picture.
With R, teams can now:
clean and standardize scans so they are comparable,
extract features like size, texture, density, or thickness,
highlight subtle abnormalities that the eye might overlook,
analyze how a tumor or tissue changes over time,
and produce clear, traceable visual overlays that support diagnosis.
This shift moved imaging from “interpretation” toward evidence-backed measurement, which is crucial for modern clinical research.
Why This Matters for Life Science and Healthcare Students
Whether you plan to work in pharma, clinical research, biotechnology, neuroscience, or diagnostics, imaging is becoming central to the future of healthcare.
Understanding how R works with images helps you:
see the deeper biological meaning hidden inside MRI/CT data,
collaborate confidently with radiology teams during trials,
engage in radiomics and AI-driven imaging careers,
and understand disease progression through data, not just visuals.
Medical imaging is no longer just about looking, it’s about analyzing, quantifying, and learning from what the scan contains. Mastering R programming in healthcare gives you that ability to bridge this gap.
R Programming Tools Used in Medical Image Analysis:
Process Stage
R Tools / Packages
What the Tools Do (Unique to Imaging)
Image Preprocessing
oro.dicom, RNifti, imager
• Load medical imaging formats into R • Adjust intensity ranges & remove scanner artifacts • Convert pixel data into analyzable matrices
Segmentation & Region Detection
ANTsR, EBImage
• Isolate anatomical structures or lesions • Align images across timepoints or patients • Detect boundaries and highlight suspicious areas
Feature Extraction (Radiomics)
radiomics, caret, mlr3
• Derive shape, texture & density measurements • Convert image regions into numerical descriptors • Prepare imaging features for predictive modeling
Predictive Modeling
randomForest, xgboost, glmnet
• Build classifiers to identify disease categories • Predict tumor progression or treatment response • Combine radiomic and clinical data for risk scoring
Visualization
ggplot2, plotly, rgl
• Generate 2D/3D rendering of segmented areas • Overlay detected regions on original scans • Create interactive imaging panels for clinicians
Reporting & Output
R Markdown, knitr, shiny
• Produce structured imaging summaries • Generate interactive radiology dashboards • Automate export of annotated scans & results
Case Insight: Medical Imaging for Early Tumor Detection Using R In a groundbreaking study, R was used to analyze MRI data for detecting early-stage brain tumors. Researchers employed ANTsR to process complex imaging data, highlighting irregularities such as tumors or plaques, particularly for Alzheimer’s disease. By automating the detection process, R significantly reduced the time spent analyzing each scan while improving accuracy. This R-powered approach is a game-changer, ensuring that tumors and diseases are identified at their earliest stages, where treatment can be most effective. Early diagnosis leads to better treatment options and improves long-term outcomes, showcasing the vital role of R in medical image analysis.
5. Personalized Medicine
Every patient is different. Two people with the same diagnosis can respond very differently to the same drug. One recovers quickly; the other gets side effects or no benefit at all. Personalized medicine tries to understand why, by looking at a patient’s genes, medical history, lab markers, and even lifestyle factors to find the treatment that fits them best.
It’s basically moving from “What works for most people?” to “What works for this person?”
The Challenge Behind Personalization: Too Much Data, Too Many Contradictions
Before tools like R became common, personalization was more theory than practice. Doctors had patient history and lab results, but nothing that could combine genomics, biomarkers, symptoms, and long-term patterns into one meaningful picture.
The problems were straightforward:
data came from different systems and didn’t match,
genomic information was hard to interpret without proper statistics,
small sample sizes made patterns easy to misread,
and comparing treatment options objectively was almost impossible.
So even though the science existed, the practical workflow for real personalized care was missing.
R Programming in Personalized Medicine Changed the Game
R makes personalization achievable by turning scattered information into structured, analyzable insight.
With R, researchers and clinicians can bring all patient data (genomic variants, biomarkers, symptoms, treatment history, etc.) together and identify meaningful patterns that show why certain patients respond differently. R also helps them in predicting which therapy is likely to work best, visualize risks and expect outcomes clearly. Doctors could rely on R to produce patient-specific reports to make informed and confident decisions. Instead of guessing based on averages, R helps medical teams see evidence for each individual.
Why Life Science & Healthcare Students Should Care
This area is exploding. Pharma, oncology centers, genetic-testing companies, CROs, and research labs all need people who understand how to interpret patient-level data.
Learning how R fits into personalized medicine helps you:
Understand how genes and clinical features connect
Collaborate on precision-oncology or genomics projects
Support doctors in making data-backed treatment decisions
And work on the growing field of individualized therapies.
In short: Personalized medicine is the future of clinical care, and R is one of the tools turning that future into something practical.
R Programming Tools Used in Personalized Medicine & Treatment Planning
Process Stage
R Tools / Packages
What the Tools Do (Unique Functions)
Data Integration
dplyr, tidyr, data.table
• Combine multi-source patient data into one profile • Match genomic records with clinical timelines • Align patient identifiers across datasets
Genomic & Biomarker Processing
Bioconductor, VariantAnnotation, GenomicRanges
• Extract mutation details linked to treatment choices • Annotate genetic variants with clinical relevance • Map biomarkers to disease-specific genomic regions
Predictive Modeling for Treatment Response
caret, randomForest, glmnet, xgboost
• Train models that estimate how well a patient will respond to therapies • Rank treatment options based on predicted effectiveness • Generate individualized risk or benefit scores
Risk Scoring & Outcome Estimation
survival, rms, mlr3
• Produce personalized survival curves • Quantify relapse probabilities for specific treatments • Compare long-term outcomes for different therapy plans
Clinical Visualization
ggplot2, plotly, survminer
• Display patient-specific treatment comparison charts • Visualize genomic alterations tied to therapy decisions • Show survival probability curves tailored to individual patients
Reporting & Clinical Output
R Markdown, knitr, Shiny
• Create customized treatment recommendation documents • Build interactive clinician dashboards • Present patient-level analytics in an easy-to-read format
Case Insight: Oncological Treatment Planning with R In a study on personalized cancer treatment, oncologists used R to analyze genetic mutations, tumor markers, and patient history to develop targeted therapies for individuals. By employing machine learning models, they were able to predict how patients would respond to different chemotherapy regimens, ensuring that the treatment plan was customized to each patient’s genetic profile. This R-powered approach to personalized medicine is a game-changer, helping oncologists make more informed decisions and improve patient outcomes. With R, oncologists are not just treating the disease they’re tailoring treatment to the person, making cancer care more effective than ever before.
PG DIPLOMA IN
Bioinformatics
Develop practical skills at the intersection of biology, data, and computation. This program prepares you to work with genomic and proteomic data, apply programming tools, and support real-world research and drug discovery workflows.
Healthcare is full of tough choices. A new drug might extend life by a few months but cost far more than most hospitals or governments can realistically afford. Another treatment might be cheaper but offer very limited benefit. Cost-effectiveness analysis exists to answer a basic but uncomfortable question: Is the health benefit worth the cost?
This isn’t about cutting corners. It’s about making sure limited resources are used in ways that help the most people.
Before R: Important Questions, Slow Answers
Earlier, teams relied on spreadsheets and manual calculations to compare treatments. They had to pull together data from hospital bills, insurance claims, patient records, and clinical outcomes. Because this information came from different systems and used different formats, analysts spent more time fixing the data than actually studying it.
Even once the data was ready, running complex economic models was difficult. Predicting long-term costs, estimating quality-adjusted life years (QALYs), or testing how results change under different assumptions often pushed tools like Excel far beyond their limits. As a result, many decisions were delayed, or made with only a partial understanding of the real impact.
After R: Clear, Defensible Evidence for Policy Decisions
R changed this process by giving analysts a single environment where healthcare costs, patient outcomes, and long-term disease trends can all be studied together. Instead of wrestling with disconnected files, teams can clean and combine their data inside R, build models that realistically show how a disease progresses, and compare the true value of different treatments.
R also makes it easy to run large simulations that show best-case, worst-case, and most likely scenarios. This matters because healthcare decisions are rarely black-and-white. When R produces graphs and summaries showing how each treatment performs over time, policymakers finally get evidence they can trust and defend.
What once took months of manual work can now be repeated in minutes, with far greater clarity.
Why This Matters for Life Science and Healthcare Students
Every major healthcare system now uses cost-effectiveness studies to decide which treatments to fund, which vaccines to introduce, and how to allocate limited budgets. Pharma companies use these studies to demonstrate the value of new drugs. Governments use them to build fair and sustainable health programs. Hospitals use them to plan for long-term resource needs.
Students who understand how R fits into this process gain a major advantage. It helps them connect scientific outcomes with real-world health decisions, opening doors to roles in health economics, policy analysis, clinical research, pharmacoeconomics, and public-health planning. Even if someone never becomes a health economist, understanding how value is measured makes them a stronger and more aware healthcare professional.
R Programming Tools Used in Healthcare Cost-Effectiveness & Policy Analysis
Process Stage
R Tools / Packages
What the Tools Do (Unique & Non-Repetitive)
Data Preparation & Standardization
dplyr, tidyr, data.table
• Organize cost data into economic models • Combine treatment, hospitalization, and insurance datasets • Align time periods and financial variables for comparison
• Produce policy-ready economic evaluation reports • Build dashboards for exploring cost scenarios • Present models interactively for committees and stakeholders
Case Insight: Assessing the Cost-Effectiveness of New Healthcare Interventions Using R A recent study used R to assess the cost-effectiveness of a new vaccine for an emerging infectious disease. Using BCEA, researchers compared the costs of vaccination campaigns against the potential savings from reduced healthcare utilization, such as hospitalizations and treatments. The results showed that the vaccine would not only save lives but also reduce healthcare system burdens, making it a highly cost-effective intervention. R’s ability to provide these kinds of insights helps policymakers make more informed decisions, ensuring that healthcare systems can deliver the greatest value with their available resources. With R, the future of healthcare is not just about improving health outcomes but doing so in a way that is sustainable and economically efficient.
7. Predicting Patient Outcomes in Chronic Disease
Chronic diseases like diabetes, heart failure, hypertension, or kidney disease don’t appear suddenly. They progress slowly, often showing small warning signs months before a major complication. Doctors already collect a lot of information from these patients, blood sugar trends, blood pressure readings, lab tests, medication history, even data from wearables. But seeing all these signals together, and understanding what they mean for the patient’s future, is extremely difficult without the right tools.
This is where predictive analytics comes in: it helps answer questions like “Is this patient headed toward a hospitalization?” or “Who needs urgent intervention?” long before symptoms become dangerous.
Before R: Valuable Data, But No Way to See the Full Picture
For years, clinicians had access to these records, but the data lived in different systems and formats. One piece was in the EHR, another in lab reports, another in patient diaries, and another in wearable apps. Even when all the data was available, it was nearly impossible to combine it into a timeline that showed how the patient was actually progressing.
It was hard to identify patterns from noise, and predicting risks relied mostly on experience, not evidence. Without a structured way to analyze long-term data, many complications were detected only when they had already become serious.
After R: Clear Health Trajectories and Early Intervention
R helps turn years of scattered patient information into meaningful timelines that show how someone’s health is changing. Once the data is organized, R can pick up subtle trends, a slow rise in blood pressure, irregular heart-rate patterns, unstable glucose swings, or gradual kidney decline, long before they trigger a medical emergency.
By building prediction models, R estimates how likely a patient is to experience events like hospitalization, stroke, or sudden worsening of symptoms. And instead of burying this in numbers, R generates risk curves and simple visual summaries that clinicians can read instantly. This allows doctors to adjust treatment plans earlier, prevent complications, and personalize long-term care.
Instead of reacting to problems, healthcare teams can stay one step ahead.
Why This Matters for Life Science and Healthcare Students
Chronic diseases make up a huge portion of global healthcare needs, and every hospital, insurance company, and public-health agency now relies on predictive analytics to manage them. Understanding how R supports this work helps students see how data and biology connect in real-world care. It opens opportunities in clinical research, digital health, chronic-disease management programs, wearable-device analytics, and health-tech companies building early-warning systems.
Most importantly, it shows future healthcare professionals how data, when used correctly, can transform patient care from reactive to preventive, a shift that defines the future of medicine.
R Programming Tools Used in Predicting Chronic Disease Outcomes
Process Stage
R Tools / Packages
What the Tools Do
Data Cleaning & Time-Series Structuring
dplyr, zoo, lubridate
• Organize long-term health data into timelines • Handle irregular timestamps, missing dates, and noisy readings • Standardize clinical measurements across visits
Feature Engineering for Clinical Predictors
caret, recipes, tsfeatures
• Create clinically meaningful variables (e.g., glucose variability, BP trend slopes) • Normalize health indicators for modeling • Extract temporal features from wearable or sensor data
Risk Modeling & Prediction
randomForest, xgboost, glmnet
• Predict complications (stroke, hospitalization, kidney failure) • Rank the most important predictors for each patient • Build models tailored for chronic disease progression
Trend Visualization & Risk Trajectories
ggplot2, plotly, timetk
• Draw patient-specific risk curves over time • Visualize changes in vitals, labs, and symptoms • Build interactive time-series charts for clinicians
Clinical Reporting & Monitoring Dashboards
R Markdown, flexdashboard, Shiny
• Generate clinician-friendly reports showing risk levels • Provide interactive dashboards for ongoing monitoring • Enable early alert systems for high-risk patients
Case Insight: Predicting Heart Disease Risk in Diabetic Patients Using R In a recent study, R was used to predict the risk of heart attacks and strokes in diabetic patients. Using randomForest and glmnet, researchers built a predictive model based on factors like blood sugar levels, cholesterol, and physical activity. The model successfully identified high-risk patients who could benefit from early interventions, like lifestyle changes or medication adjustments. This R-powered approach is revolutionizing how chronic diseases are managed by providing more accurate, data-driven predictions that guide clinical decisions and improve patient care. By focusing on early risk identification, healthcare providers can take timely action, helping prevent serious complications and ensuring better health outcomes.
8. Health Informatics & Data Integration
In a hospital, a single patient’s information lives in many different systems. Lab tests sit in one database, imaging files in another, prescriptions and pharmacy logs somewhere else, and wearable-device data inside its own separate platforms. All of these pieces matter for care, yet they rarely connect smoothly. Health informatics tries to bring them together so doctors and administrators can finally see a complete, accurate picture of the patient. But because each system uses different formats and codes, the process is harder than it sounds.
Before R: A Lot of Data, But No Unified View
Traditionally, teams tried to merge this information manually. They downloaded spreadsheets, copied values from hospital systems, and tried to line things up patient by patient. But even small mismatches in names, dates, or codes made merging difficult. Records didn’t align naturally, timestamps varied across systems, and imaging files needed special tools to even open. The result was that hospitals technically had a lot of data, yet lacked a single source of truth. Important trends stayed hidden, workflow delays were hard to trace, and clinicians often made decisions based on incomplete information.
After R Programming in Healthcare Data Analytics: A Clean, Connected Picture of Patient Journeys
R finally gives analysts a way to bring all these pieces together. Once the different datasets are imported, R can clean them, standardize formats, fix inconsistencies, match patient identifiers, and align timelines. What used to be scattered becomes a unified patient story. When the data is organized this way, patterns begin to appear clearly, how long diagnoses take, where treatment delays happen, which processes slow down patient care, and what parts of the hospital system need improvement.
R doesn’t stop at cleaning. It also turns these insights into visual dashboards and clear summaries that teams can use immediately. Clinicians see patient journeys more clearly, administrators understand bottlenecks, and hospitals make decisions based on complete and reliable information instead of fragmented data.
Why This Matters to Life Science and Healthcare Students
Healthcare is becoming more data-driven every year, and understanding how information flows through a hospital system is now a core skill. Students who learn how R fits into health informatics gain a strong advantage. They develop the ability to interpret patient data in a broader context—biological, clinical, and operational. This opens the door to careers in clinical analytics, hospital quality teams, digital health companies, EHR-driven projects, and research environments where integrated data is essential.
Seeing the full patient story in one place is powerful, and R is one of the tools making that possible.
Process Stage
R Tools / Packages
What the Tools Do
Data Extraction & Cleaning
dplyr, data.table, janitor
• Clean EHR tables and remove coding inconsistencies • Handle large administrative datasets efficiently • Standardize variable names and fix metadata issues
Health Data Integration & Mapping
tidyverse, FHIR, jsonlite
• Merge patient records from multiple clinical systems • Work with FHIR-formatted data for healthcare interoperability • Parse and combine JSON-based EHR or wearable data
Clinical & Operational Analysis
tableone, healthcareai, arules
• Generate clinical summary tables for patient cohorts • Detect workflow inefficiencies or risk patterns • Identify associations in patient behavior or treatment pathways
Visualization of Integrated Data
ggplot2, plotly, visNetwork
• Visualize hospital workflows, patient journeys, and diagnostic timelines • Build interactive charts for care-coordination teams • Map connections between patient records or clinical events
Dashboards & Reporting
Shiny, flexdashboard, R Markdown
• Create real-time hospital dashboards for monitoring patient status • Build administrative dashboards for admissions, labs, or resource allocation • Generate structured reports for clinical leadership
Case Insight: Comprehensive Patient Profiling Using R A hospital system recently implemented R to integrate data from EHRs, wearable devices, and lab results to create a comprehensive patient profile. Using dplyr and tidyr, they merged data from various sources into a single dataset, Which enabled healthcare professionals to track patient progress over time more effectively. By having a full, real-time picture of the patient’s health, clinicians were able to adjust treatments more quickly and prevent complications, leading to better overall care. This integration of health data with R has proven to be a game-changer in how healthcare providers make decisions, ensuring that patients receive timely, personalized care and improving the overall efficiency of the healthcare system.
Career Opportunities After Learning R Programming in Healthcare
As healthcare data grows, R programming is becoming essential in fields like AI, machine learning, bioinformatics, and genomics. R’s strengths in real-time data processing and predictive analytics are driving innovations in personalized care and clinical decision making, making it an indispensable tool for professionals. Careers leveraging R include healthcare data science, clinical data analysis, and bioinformatics, where professionals analyze data and develop predictive models. These roles increasingly rely on R for health data science, where professionals combine statistical rigor with real-world clinical datasets to drive insights.
For students entering healthcare, R programming unlocks access to high demand roles. It’s not just about mastering the language, but how students position themselves. Focusing on real-world projects and gaining hands-on experience through internships and open-source projects allows students to build a strong portfolio and network with industry professionals.
As demand for healthcare data professionals grows, salaries are rising. In India, data scientist roles typically offer ₹6 LPA – ₹14.4 LPA, while in the U.S., the average salary is US $129,336/yr. with the growing focus on personalized medicine and AI/ML, the demand for R programming skills is expected to rise, offering abundant opportunities for professionals and students to shape healthcare’s future.
Conclusion
What makes R valuable is not the language itself, but what it enables. It allows healthcare professionals to work with messy, high-volume data, apply the right statistical methods, and produce results that can be trusted, reviewed, and reused. This is why R continues to be used across hospitals, pharma companies, research labs, and public-health organizations worldwide.
For students and early professionals, learning R means moving beyond theory. It means understanding how data supports drug development, disease monitoring, patient safety, and healthcare policy in real-world settings. As healthcare becomes increasingly data-driven, professionals who can analyze, interpret, and clearly communicate insights using R will remain in strong demand.
Building these skills requires more than isolated tutorials. It requires structured learning, real datasets, and domain-specific context—at CliniLaunch that’s exactly what our career-focused healthcare and life sciences programs aim to provide. If you’re looking to grow into roles where data genuinely shapes healthcare decisions, exploring the right learning path early makes all the difference.
FAQs
1. How is R programming used in healthcare? R is used to analyze clinical data, run statistical tests, model disease trends, study genomics, and support research in trials, epidemiology, and public health.
2. Can I use R instead of SPSS? Yes. R can do everything SPSS does and more. It’s widely used in research because it’s flexible, transparent, and free.
3. Which language is best for medical coding? Medical coding itself doesn’t require programming. For analytics and healthcare data work, R and Python are more relevant than coding languages used in billing systems.
4. Can R read SPSS files? Yes. R can easily import SPSS files using packages like haven.
5. Can I learn R in 3 months? Yes, for practical healthcare use. You can learn data handling, visualization, and basic analysis in 3 months with focused practice.
6. How do I import data into R? You can import data from Excel, CSV, SPSS, databases, and APIs using built-in functions and packages like readr, readxl, and haven.
7. Is R harder than Excel? Yes, initially. But R is far more powerful once you move beyond basic analysis and repetitive manual work.
8. Do epidemiologists use R? Yes. R is one of the most widely used tools in epidemiology for outbreak analysis, modeling, forecasting, and reporting.
9. Which programming language is best for bioinformatics? R and Python are the top choices. R is especially strong in statistics, genomics, and biological data analysis.
10. What is R used for in biology? R is used to analyze gene expression, genomic data, experimental results, and biological trends in research and healthcare.
Machine learning in healthcare is reshaping how diseases are detected, diagnosed, and treated. Imagine a system where illnesses are caught earlier, treatments become more precise, and patient risks are predicted before they turn critical. That shift is happening because ML models learn from medical data the way doctors learn from experience, but at a scale no human can match. In a recent study, ML-assisted radiology systems showed higher sensitivity and negative-predictive value than radiologists working alone, proving how machine learning strengthens clinical decision-making.
Similarly, a 2022 meta-analysis confirmed that machine-learning models, especially deep-learning architectures, achieved strong diagnostic performance in lung cancer detection using imaging and histopathology data.
These breakthroughs mark a major shift in how healthcare operates. Machine learning is empowering doctors with predictive insights, supporting early diagnosis, accelerating clinical decisions, and personalizing treatment like never before. Instead of reacting to illness, hospitals can now anticipate it — creating a smarter, faster, and more life-saving healthcare ecosystem.
All of this brings us to the real question: why is machine learning suddenly at the heart of modern healthcare? To understand its growing impact, we need to look at what is driving this massive transformation.
Why Healthcare Depends on ML Today
Healthcare today deals with more data than any human can process — scans, lab results, vitals, wearables, EHRs, genetics, everything. Doctors simply don’t have the time to analyze all of them deeply. That’s where machine learning becomes essential. ML can quickly sort through massive data, spot tiny patterns that are easy to miss, and help doctors make decisions faster and with more confidence.
Because of this, ML has sparked some major advancements. It has improved early disease detection, boosted accuracy in reading medical images, predicted patient risks before emergencies happen, and even sped up drug discovery by analyzing molecules in ways humans can’t. It also supports personalized treatment by learning what works best for each type of patient. In short, ML didn’t just assist healthcare — it pushed it into a new level of speed, precision, and prevention.
Before ML vs After ML in Healthcare
Area
Before ML
After ML
Diagnosis
Relied heavily on human interpretation; slower; prone to errors
Faster, data-driven, high accuracy; ML supports specialists
Medical Imaging
Manual reading; could miss subtle patterns
ML detects patterns invisible to the human eye; earlier detection
Treatment Plans
Mostly generalized for all patients
Personalized treatment based on patient-specific data
Disease Prediction
Limited predictive ability
Predicts risks, complications, and disease progression early
Monitoring
Periodic checkups
Continuous real-time monitoring with ML-powered wearables
Drug Discovery
Long, expensive, trial-and-error
Faster molecule prediction & drug design
Clinical Workflows
High workload, paperwork, delays
Automated documentation, faster decision support
Data Analysis
Manual, slow, limited
Instant processing of huge datasets; actionable insights
How Machine Learning Powers Healthcare: A Step-by-Step Process of Implementation
To appreciate the capabilities of ML in healthcare, we need to understand its workflow from data collection to prediction and the core components that support each stage.
1. Data Collection
Machine learning relies heavily on high-quality healthcare data, the core component that fuels its ability to learn real medical patterns. This includes scans, EHR entries, lab reports, pathology slides, wearables, and even genomic data — each piece adding depth to how well the model understands diseases, symptoms, and normal vs abnormal health signals.
In real hospitals, this data flows from imaging centers, ICUs, pathology labs, and patient wearables, creating a rich and diverse dataset that helps ML models view patient health holistically and make more accurate predictions.
Case Insight
When diabetic patients were not getting specialist eye screenings on time, researchers deployed IDx-DR, an autonomous ML system, directly in primary care clinics. It analyzed retinal images collected on-site and detected diabetic retinopathy with 87.2% sensitivity, 90.7% specificity, and 96% usable images — showing how collecting real medical images in everyday clinics can power ML to make accurate diagnoses instantly.
2. Data Cleaning & Preprocessing
This stage relies heavily on the data preprocessing pipeline, the core component responsible for transforming raw medical data into something a model can actually learn from. In healthcare, data is often messy — missing lab values, inconsistent formats, duplicate entries, or device-generated noise. The preprocessing pipeline steps in to clean all of this by fixing errors, filling missing values, removing duplicates, and standardizing formats so the information becomes clear and reliable.
This process may look simple, but it’s one of the most crucial steps in the ML workflow. A model is only as good as the data it learns from, and in clinical settings, even small inconsistencies can lead to incorrect patterns. By turning chaotic patient data into a structured, high-quality dataset, preprocessing ensures that the model starts its learning journey on solid ground.
Case Insight
TREWS analyzes patient vitals, labs, and EHR trends — but only after they are cleaned and standardized through preprocessing pipelines. This allows the ML system to accurately identify early sepsis patterns that humans often miss. When doctors responded to these ML alerts within 3 hours, mortality fell by 3.3% across 5 hospitals.
3. Feature Extraction / Selection
With clean data in place, the next step is powered by feature engineering, the core component that helps the model identify the most important medical signals. This is where ML goes beyond raw numbers and begins to understand what truly matters — whether it’s the sharp edges of a tumor in an MRI, the subtle peaks in an ECG waveform, or unusual trends in a patient’s vitals.
Good feature engineering acts like a spotlight. It highlights the patterns that carry real clinical meaning and dims the noise that could mislead the model. By giving the system the right cues, it ensures the model focuses on the features that doctors actually rely on, setting the stage for more accurate prediction and diagnosis.
Practical Highlight
ML systems trained on ECG signals can extract subtle features such as heartbeat intervals, waveform peaks, and irregular rhythm patterns. These models often detect atrial fibrillation (AF) more accurately than traditional rule-based methods — and they can do it using everyday wearable devices like smartwatches. This enables early AF detection outside hospitals, making cardiac monitoring more accessible and proactive.
4. Selecting the Right ML Model
Selecting the right ML model is really about choosing how you want the system to think. Each algorithm has its own strengths. CNNs excel at spotting patterns in medical images; NLP models are built to understand clinical notes; and predictive models are great for early-warning alerts or risk scoring. Because healthcare problems vary so much, the choice of model depends entirely on the type of data and the clinical need.
In real teams, Data Scientists experiment with several algorithms, testing what works best, while ML Engineers build and prepare the pipelines needed to train and run them. Clinicians also play a key role here, ensuring the model’s predictions align with real medical reasoning, not just statistical logic.
When this choice is made correctly, the model fits naturally into the clinician’s workflow and improves decision-making without causing friction. To make this clearer, here’s a quick breakdown of the major ML model types and what role each one plays in healthcare:
Model Type
What It Is
How It Works
Purpose
Used For
Supervised Learning
Models trained with labeled data
Learn patterns by comparing predictions with correct answers
Neural networks with many layers (CNN, RNN, Transformers)
Automatically extracts complex features from images, text, or signals
High-accuracy pattern recognition
X-rays, CT/MRI, ECG analysis, clinical text
Reinforcement Learning
Models that learn by trial and error using rewards
Choose actions → get feedback → improve strategy
Decision-making
ICU decisions, treatment optimization, drug dosing
Probabilistic (Bayesian) Models
Models based on probability and uncertainty
Updates predictions as new data arrives
Safe, interpretable predictions
Disease progression, risk estimation
Practical Highlight
Hospitals use deep convolutional neural networks (CNNs) for lung and breast cancer detection because CNNs outperform traditional ML in recognizing subtle visual patterns in CT and mammography images.
5. Model Training
Training is the stage where the model actually learns from real patient data. It’s the point where the system evolves from “blank” to “clinically aware,” processing thousands of X-rays, ECG signals, or EHR entries until it begins to recognize meaningful medical patterns. Because healthcare data is massive and complex, this step needs serious compute power — GPUs, TPUs, or cloud infrastructure capable of handling huge workloads efficiently.
While the model is learning, Data Scientists fine-tune hyperparameters, adjust learning rates, and rebalance datasets to make sure the model doesn’t overfit or learn the wrong patterns. ML Engineers work in parallel to ensure the entire training pipeline runs smoothly, especially when training is distributed across multiple machines.
Here’s a clear breakdown of the key tool categories that make ML training in healthcare possible:
Category
Tools
Purpose
Who Uses It
Deep Learning Frameworks
TensorFlow, PyTorch, Keras
Build and train ML models; define layers, losses, optimizers
Data Scientists, ML Engineers, Researchers
Experiment Tracking
MLflow, Weights & Biases, TensorBoard
Log runs, compare models, monitor accuracy/loss
Data Scientists, ML Engineers
Data Pipeline Tools
Airflow, Apache Spark, PyTorch DataLoader
Preprocess large datasets, automate workflows
Data Engineers, ML Engineers
Compute & Hardware
GPUs, TPUs, Cloud VMs (AWS/GCP/Azure)
Provide the power needed for heavy training
ML Engineers, Cloud Engineers, AI Infrastructure Teams
Cloud ML Platforms
AWS SageMaker, Google Vertex AI, Azure ML
Train models at scale without managing servers
ML Engineers, Data Scientists
Hyperparameter Tuning
Optuna, Ray Tune, Hyperopt
Auto-optimize model parameters for best performance
Data Scientists
Data Storage
AWS S3, GCP Storage, Azure Blob, PACS/DICOM
Store imaging, EHR, and large medical datasets
Data Engineers, ML Engineers
Case Insight
DeepMind trained a model on 703,782 VA patient records using large-scale GPU infrastructure. The trained model predicted 55.8% of AKI cases 48 hours early and 90.2% of severe kidney injury cases requiring dialysis — showing how high-performance computing enables powerful predictive healthcare models.
6. Validation & Evaluation
Before any ML model is deployed in a hospital, it must undergo strict validation to prove it is safe, reliable, and trustworthy. Healthcare uses rigorous evaluation metrics — sensitivity, specificity, precision, recall, F1-score, and AUC — because patient safety depends on accuracy in real situations. Sensitivity ensures serious conditions aren’t missed, while specificity prevents unnecessary alerts that overwhelm doctors.
Validation teams test the model on completely unseen patient data to make sure it generalizes well beyond its training set. Clinical researchers, regulatory bodies, data scientists, and QA teams collaborate during this stage to confirm that the model behaves responsibly in real clinical environments.
Area
Key Checks
Data Validation
Quality check, no data leakage, balanced groups, multi-hospital data
After a model passes validation, the next step is getting it into the hands of clinicians — and this relies on deployment platforms, the core component that brings ML into real medical workflows. These platforms integrate the model directly into tools doctors already use, like radiology workstations, EHR dashboards, clinical apps, or even patient wearables.
The goal here is simple: deliver predictions in a clear, actionable, and seamless way. Whether it’s highlighting abnormalities on a scan or displaying a risk score inside a patient’s chart, deployment platforms ensure the model’s intelligence becomes part of everyday clinical decision-making without disrupting the existing flow of work.
Practical Highlight
Many hospitals using the Epic EHR system rely on the Epic Sepsis Model (ESM) — a machine-learning-based risk scoring tool that continuously analyzes patient vitals, labs, and clinical data already stored in the EHR. The model updates sepsis risk scores automatically throughout the day, displaying alerts directly inside the patient’s chart. This allows clinicians to receive early warnings without switching screens or using additional software.
8. Prediction & Real-Time Decision Support
At this stage, the model finally steps into real clinical action, powered by the inference engine — the core component that enables instant, real-time predictions. As new patient data flows in, the inference engine processes it within seconds, allowing the system to detect abnormalities, forecast patient deterioration, or even suggest possible treatment steps right when they’re needed most.
This real-time intelligence is what makes ML truly valuable at the bedside or in the emergency room. Instead of waiting for manual review or delayed analysis, clinicians receive immediate insights that support faster, more informed decision-making during critical moments of patient care.
Even after deployment, the model’s journey isn’t over. Its growth is driven by the feedback loop — the core component that allows ML systems to keep learning from real clinical outcomes and day-to-day doctor interactions. Every corrected prediction, every mislabeled scan, and every new patient case becomes valuable information that helps the model evolve.
Through this continuous flow of feedback, the model adapts to new patterns, refines its predictions, and steadily becomes more accurate and reliable over time. In a field as dynamic as healthcare, this ability to learn from real-world practice is what ensures ML stays relevant, up-to-date, and increasingly aligned with clinical needs.
Case Insight
Radiologists working with AI-assisted breast cancer screening systems often catch more subtle cancers than when working alone. A 2025 multicenter study demonstrated that combining radiologist judgment with AI-CAD significantly improved cancer detection rates while reducing reader workload — showing how real-world clinical feedback and human-AI collaboration strengthen the accuracy and reliability of breast cancer screening tools.
How ML Training Gives Students a Massive Career Boost in Healthcare
Machine learning is revolutionizing healthcare, and students who master both medical data and ML are becoming some of the most sought-after professionals today. By gaining hands-on experience with real-world datasets like EHRs, MRI scans, and lab results, students can directly contribute to healthcare advancements. These are the same data used by hospitals, health-tech companies, and diagnostics startups to detect diseases earlier, analyze medical images, and predict patient risks with remarkable accuracy.
This unique combination of medical knowledge and technical skills opens the door to high-impact roles such as Healthcare Data Scientist, AI Radiology Analyst, Bioinformatics Specialist, Clinical Data Engineer, and Medical AI Product Designer. The demand for these roles is rising fast, with the U.S. Bureau of Labor Statistics projecting a 15% growth in data science jobs from 2022 to 2032.
As AI becomes critical in diagnostics, drug discovery, clinical automation, and wearables, students trained in ML are in prime position for future-ready, high-demand roles. The healthcare sector needs professionals who can blend medical expertise with machine learning to drive innovation forward.
Conclusion
Machine Learning is transforming healthcare through early detection, smarter decisions, and more precise treatments — and students who learn ML today will be the innovators leading tomorrow’s medical breakthroughs. If you want to be part of the future of healthcare, now is the right time to begin. CliniLaunch Research Institute offers a specialized AI & ML in Healthcare course designed to equip aspiring professionals with the skills needed to thrive in this rapidly evolving field.
Today’s healthcare ecosystem generates enormous amounts of data, ranging from electronic health records and lab reports to imaging files and clinical trial outputs. According to a 2024 report from MarketsandMarkets, the global healthcare analytics market is projected to grow from USD 36.3 billion in 2023 to USD 94.8 billion by 2028 at a CAGR of 21.4%, reflecting how rapidly data-driven decision-making is reshaping healthcare.
In this data-rich environment, Statistical Analysis in Healthcare plays a crucial role in transforming raw medical information into meaningful insights. It helps clinicians interpret patterns, validate observations, evaluate treatment outcomes, and support evidence-based decisions. Instead of leaving hospitals with scattered vitals, lab values, and clinical observations, statistical techniques bring structure and clarity to complex datasets.
As healthcare organizations adopt digital tools, analytics, and AI-powered platforms, the need to extract reliable insights from data becomes even more essential. Statistical analysis ensures that clinical decisions, hospital planning, and research outcomes are built on solid evidence, making it the backbone of modern medical practice.
What is Statistical Analysis in Healthcare?
Statistical Analysis in Healthcare refers to the use of mathematical and computational techniques to collect, organize, and interpret medical data. It converts raw information, such as lab results, patient records, and clinical trial observations, into meaningful insights that support better decision-making across hospitals and research settings.
Statistical analysis is essential for evaluating patient outcomes, measuring treatment effectiveness, tracking disease patterns, and improving hospital operations. It forms the backbone of evidence-based medicine. Whether used in clinical research, public health studies, statistical methods help healthcare professionals identify patterns, make accurate predictions, and enhance the overall quality of care.
Major Workflow Components and Tools in Healthcare Statistics
1. Data Collection
Data collection is the foundation of statistical analysis in healthcare. gathers information from multiple clinical and operational systems, EHRs, lab platforms, imaging devices, wearables, and clinical trial systems, to build a complete picture of patient health. The accuracy of all downstream analysis depends on how well data is captured at this stage.
Data is pulled from every patient interaction: consultations, diagnostics, prescriptions, lab reports, vital signs, and trial observations. These inputs are entered into hospital systems or research platforms and moved into central databases where they can be accessed for analysis.
Applications Used for data collection
Category
Applications
EDC Systems (Clinical Trials)
Medidata Rave, Oracle Clinical
Hospital Information Systems (HIS)
HIS platforms, EHR systems
Wearable/Remote Monitoring Systems
Device-generated continuous health data
2. Data Cleaning & Preparation
Data cleaning and preparation ensure that raw healthcare data becomes accurate, complete, and consistent. Because medical data often contains missing entries, duplicate results, and format inconsistencies, this step is essential for ensuring reliability before applying statistical methods.
The workflow includes removing duplicates, correcting inconsistencies, handling missing values, standardizing formats, and validating the dataset. Cleaned datasets are then converted into analysis-ready structures that support accurate statistical calculations.
Applications Used for data cleaning and preparation
Category
Applications
Programming Languages
Python (Pandas, NumPy), R
Regulatory-Grade Cleaning
SAS (widely used in clinical trials and pharma)
3. Data Organization & Classification
Organizing and classifying data helps structure patient information into meaningful groups. This stage categorizes patients by demographics, diagnoses, lab results, treatment arms, or symptom clusters to reveal patterns and support comparative analysis.
Cleaned data is sorted, grouped, and labeled based on clinical relevance. Variables are categorized (e.g., age groups, disease stage), and datasets are segmented into cohorts for further analysis.
Applications Used for data organization and classification
Category
Applications
Basic Organizational Tools
Excel, Power BI
Statistical Grouping Tools
SPSS (grouping, labeling, descriptive summaries)
4. Statistical Testing & Modeling
Statistical testing and modeling transform clinical data into reliable insights. Methods such as hypothesis testing, regression modeling, linear regression, logistic regression, and survival analysis help measure treatment impact, identify key risk factors, compare options, and project long-term outcomes.
1.Defining the Clinical Question
Statistical analysts collaborate with clinicians, principal investigators, and data management teams to refine the clinical question. During this step, they collect study protocols, endpoint definitions, patient demographics, inclusion/exclusion criteria, operational workflows, and expected outcome measures to understand exactly what the analysis must answer. This ensures that the clinical question is precise, measurable, and aligned with the study’s goals.
2.Formulating Hypotheses or Modeling Objectives
Statistical analysts derive assumptions and prediction goals by reviewing the study protocol, clinical rationale, prior evidence, and predefined endpoints shared by clinical and scientific teams. They formulate hypotheses by translating these clinical expectations into a null hypothesis (no effect or no difference) and an alternative hypothesis (expected effect or difference), ensuring the outcomes are measurable and testable. We will discuss deeply about this concept in the upcoming session of the blog.
The choice of statistical methods is then guided by data type, study design, sample size, variable relationships, and regulatory standards. Objectives are finalized only after confirming that the available data can support statistically valid comparisons or predictions, ensuring alignment between clinical intent and analytical rigor.
3.Selecting the Appropriate Statistical Technique
Statistical analysts determine the right method by assessing the data type, study design, sample size, distribution, and the outcome being measured. They evaluate assumptions like normality, independence, and event frequency to ensure the technique is statistically valid. Based on these conditions, they may choose regression-based methods or survival analysis approaches when time-to-event outcomes are involved. You’ll find these techniques explained in the following sections, helping you see how each method fits into real-world healthcare analysis.
4. Executing Statistical Tests and Models
Statistical analysts first summarize each group using measures like mean, median, mode, variance, and standard deviation to understand baseline patterns. By digging into the upcoming session, you will get to know more. They then apply the chosen techniques in SAS, R, or Python—testing differences between groups or fitting regression and survival models to generate predictions. Throughout the process, they review coefficients, probabilities, and model diagnostics to ensure the results are accurate, valid, and clinically meaningful.
5. Validating Model Accuracy and Assumptions
To ensure model reliability, analysts check assumptions such as normality (data distribution), linearity (relationship type), independence (data freedom), and homoscedasticity (equal variance). They assess multicollinearity (refers to a situation where two or more predictor variables (independent variables) in a regression model are highly correlated with each other correlation) using Variance Inflation Factor(VIF) (Collinearity measure) and evaluate the model’s goodness-of-fit with metrics like R-squared (fit measure), AIC (model quality), and p-values (statistical significance). Residual analysis (error check) helps verify randomness and detect outliers, while diagnostic plots identify influential data points. Analysts also measure predictive accuracy using MSE (prediction error), RMSE (error magnitude), and ROC curves (model performance). Adjusting the model as needed to ensure it accurately represents the data for clinical decision-making.
Statistical analysts identify differences and trends by analyzing key outputs like group means, proportions, and regression coefficients using methods such as t-tests, ANOVA, or regression models. They compare these across treatment groups or variables to detect significant effects. Analysts focus on coefficients (strength and direction of relationships), probabilities (likelihood of an outcome), and p-values (statistical significance) to determine if the differences are meaningful or due to chance, guiding clinicians in data-driven decision-making.
7. Refining Models and Preparing Results for Decision-Making
Statistical analysts refine models by reviewing assumptions, checking for multicollinearity, and adjusting parameters to improve accuracy. They reduce errors by analyzing residuals and adjusting patterns, while incorporating better predictors based on clinical knowledge and exploratory analysis. Feature engineering enhances performance, and techniques like regularization help prevent overfitting. Finally, analysts ensure reliable predictions by using cross-validation, and RMSE (error magnitude), confirming that the model aligns with clinical logic and is suitable for decision-making. Once the model is optimized, they summarize and organize the key findings into clear insights, making the results accessible for clinical interpretation and informed decision-making.
5. Interpretation & Evidence Generation
This stage transforms statistical outputs into clear, actionable insights for healthcare decision-makers. Interpretation helps clinicians understand what the data means, while evidence generation supports research publications, regulatory submissions, quality improvement, and policy decisions.
Results are translated into summaries, visualizations, risk insights, and clinical recommendations. Findings are presented through dashboards, reports, and statistical summaries in a form that supports decision-making.
Applications Used for Interpretation and Evidence Generation
Category
Applications
Visualization & Reporting Tools
Power BI, Excel
Programming for Clinical Insights
R, Python (plots, summaries, interpretations)
Regulatory-Compliant Reporting
SAS
Effective statistical analysis in healthcare depends on a structured workflow supported by the right analytical tools. Each component of the process, from data collection to interpretation, is strengthened by specific software used across hospitals, research institutions, and clinical trials.
Types of Statistical Analysis
Before exploring complex models, it’s essential to understand the two basic ways we analyze data. These methods form the foundation of all insights—helping us explain what the data shows now and what it may reveal about the future.
Descriptive statistics focus on summarizing what is happening in the data you already have, while inferential statistics use sample data to make predictions or generalizations about a larger population. Together, they form the backbone of evidence-based decision-making in healthcare and are widely used in clinical research, public health, and hospital analytics.
Descriptive Statistics
Descriptive statistics describe and summarize data so that patterns become easy to see. In healthcare, this means turning thousands of lab results, vital signs, and patient records into clear summaries such as averages, ranges, percentages, and simple visualizations (tables, charts).
In practice, descriptive statistics work by organizing data into meaningful metrics, for example, calculating the average blood pressure in a ward, the most common diagnosis in an outpatient clinic, or the distribution of age and comorbidities in a clinical trial. These summaries help clinicians and researchers quickly understand “who” they are dealing with before testing treatments or making policy decisions.
They are heavily used to:
Define baseline patient characteristics in clinical trials.
Monitor disease patterns in public health (incidence, prevalence, mortality rates).
Build dashboards and reports that help managers and clinicians see trends over time.
The importance of descriptive statistics is growing as healthcare analytics expands. Recent market research shows that descriptive analytics still accounts for the largest share of healthcare analytics use, and the dedicated healthcare descriptive analytics segment is projected to grow from about USD 22.7 billion in 2025 to over USD 65 billion by 2030, reflecting a strong industry shift toward data-driven decision-making.
Key Statistical Indicators Used in Descriptive Statistics
Descriptive statistics rely on a set of statistical indicators that help summarize and interpret healthcare data. These indicators provide a quick overview of patient populations, treatment responses, disease patterns, or clinical trial characteristics. The most used indicators in healthcare are: Mean, Median, Mode, Variance, and Standard Deviation.
These indicators help clinicians, researchers, and data analysts understand the central tendency and variability within patient datasets, essential for making reliable, evidence-based decisions.
Mean
The mean represents the average value of a dataset. It is calculated by adding all values and dividing the number of observations. The mean is commonly used in healthcare to understand overall trends, such as average blood pressure, glucose levels, length of hospital stay, or average treatment response.
Formula: Mean (μ) = (Σx) / N
Example: A doctor wants to understand the overall blood sugar control of diabetic patients before starting a new medication. The total blood sugar value of 10 patients is 1,620 mg/dL. Dividing this by 10 gives a mean of 162 mg/dL, helping the clinician assess whether the group is generally within a normal, borderline, or high glucose range before treatment. This makes the mean a practical tool for evaluating baseline patient status.
Median
The median is the middle value of a dataset when all numbers are arranged in order. It represents the central point of the data and is especially useful when extreme high or low values can distort the mean. Because healthcare datasets often contain outliers (e.g., unusually high lab results, extremely long hospital stays), the median is frequently used to report more stable and reliable central values.
Formula:
Odd number of observations: Middle value
Even number of observations: Median = (Middle Value 1 + Middle Value 2) / 2
Example Consider the following arranged blood sugar readings of 10 patients (mg/dL): 120, 130, 140, 150, 150, 160, 170, 180, 200, 220
The middle two values are 150 and 160: Median = (150 + 160) / 2 = 155 mg/dL
Clinicians often use the median to understand the typical patient’s value when some patients have very high sugar levels due to complications. In this example, although the highest readings reach 200–220 mg/dL, the median of 155 mg/dL provides a clearer picture of the typical patient’s glycemic status before treatment. This makes the median especially effective for analyzing skewed clinical data, such as lab results, ICU stay durations, or cost of care.
Mode
The mode is the value that appears most frequently in a dataset. It is useful for identifying the most common or dominant value in a clinical measurement, especially when clinicians need to understand frequently occurring symptoms, lab results, or vital-sign patterns within a patient group.
Example : In a group of 100 patients, the most frequently recorded blood sugar value is 150 mg/dL. Mode = 150 mg/dL
Mode is often used when clinicians want to know the most common clinical presentation, for example, the most frequent blood sugar reading in a diabetic population, the most common blood type in a hospital, or the most frequently reported symptom in an outbreak. Knowing that 150 mg/dL is the most repeated value helps nurses and physicians recognize typical patterns and plan treatment protocols accordingly.
Standard Deviation
Standard deviation (SD) measures how much individual values deviate from the mean. In healthcare, it is critical for understanding variation in patient vitals, lab results, treatment responses, and population health trends. A high SD indicates large fluctuations, while a low SD indicates stability and consistency.
Formula: SD (σ) = √ [(Σ (xi – x̄)²) / N]
Example : A doctor measures systolic blood pressure for 8 patients: 118, 120, 122, 121, 119, 160, 162, 158
Most readings lie between 118–122, but three readings (158–162) are much higher, increasing the standard deviation. Standard deviation helps clinicians understand variability within a patient group. In this example, the high SD reveals that while most patients have stable blood pressure, a subset shows dangerously high values, requiring urgent attention. This variation would not be visible if the doctor only looked at the average blood pressure, making SD essential for detecting risk and guiding intervention strategies.
Variance
Variance measures how far the values in a dataset spread out from the mean. In healthcare, it is particularly useful for understandingconsistency vs. variability in patient outcomes, lab results, or treatment responses. A high variance means that patient values differ widely, while a low variance indicates that most patients show similar readings.
Formula: Variance (σ²) = (Standard Deviation) ²
Example : In a group of 50 patients, blood sugar levels range from 120 to 220 mg/dL. This wide range creates a high variance, showing significant differences in diabetes control.
High variance helps clinicians identify groups with unstable or poorly controlled conditions. In this case, some patients have excellent glucose control, while others are at risk of complications and need immediate intervention. Variance gives healthcare teams a deeper understanding of overall patient stability, something a simple average cannot reveal.
The descriptive statistics measures
Measure
Meaning (Short Definition)
Formula
Mean
Average of all values
μ = Σx / N
Median
Middle value in ordered data
(For even N): (M1 + M2) / 2
Mode
Most frequent value
No formula
Variance
How spread-out values are
σ² = Σ (x − μ) ² / N
Standard Deviation
How much values differ from the mean
σ = √Σ (x − μ) ² / N
Inferential Statistics
Inferential statistics are the branch of statistics used to make conclusions, predictions, and evidence-based decisions about larger patient populations using data from a smaller sample. Unlike descriptive statistics, which only summarize what the data shows, inferential statistics help determine whether an observed effect (such as a drop in blood pressure or improvement in survival) is real or due to chance.
Inferential methods work by applying probability-based techniques such as hypothesis testing, t-tests, ANOVA, regression models, and survival analysis. These tools evaluate whether differences between treatment groups are significant, estimate risk factors, predict clinical outcomes, and assess time-to-event patterns. This is why inferential statistics are critical in areas such as clinical trials, epidemiological studies, public healthresearch, and healthcare quality assessment, settings where decisions must be supported by scientifically valid evidence.
Inferential statistics have become even more essential in modern healthcare due to the rapid growth of clinical datasets, the adoption of AI-driven analytics, and increasing reliance on real-world evidence (RWE). According to the FDA Real-World Evidence Framework, statistical inference, it plays a key role in validating treatment effectiveness using large-scale observational data, helping accelerate regulatory decision-making.
Hypothesis testing
Hypothesis testing is a core statistical method used to determine whether a claim about healthcare data is valid — i.e. whether an observed effect (like a new treatment) is real or occurred by chance. It remains one of the most widely used tools in modern clinical research because it helps provide scientific evidence that supports or refutes treatment effectiveness, safety, or other healthcare interventions.
For example, a clinic might test a new diet plan for diabetic patients:
Group A: Patients on an old diet.
Group B: Patients on a new diet.
After 4 weeks, researchers compare the average blood sugar levels of both groups.
Type
Statement
Null Hypothesis (H₀)
The new diet does not reduce blood sugar as much as the old diet.
Alternate Hypothesis (H₁)
The new diet does reduce blood sugar more than the old diet.
A statistical test (e.g. a t-test) then checks whether the observed difference (say, 15 mg/dL) is large enough to be unlikely due to random variation. If the result yields a p-value of 0.03, there is only a 3% chance that such a difference would arise by chance — suggesting the new diet likely has a true effect.
Why Hypothesis Testing is More Important Than Ever in Healthcare
Evidence-based medicine & regulatory approval:
Clinical trials, drug approvals, and treatment guidelines all rely on hypothesis testing to validate efficacy and safety before therapies reach patients. Regulatory bodies worldwide accept results based on properly conducted hypothesis tests.
Large and complex datasets:
With growth in real-world data (EHRs, genomics, wearables, registry data), hypothesis testing helps distinguish true effects from random noise — especially in observational studies and post-market surveillance.
As healthcare shifts towards personalized treatment, hypothesis testing helps compare multiple treatments, subgroups, or biomarkers to identify which works best for whom.
Public health decisions:
In epidemiology, for vaccine effectiveness, disease outbreaks, population health studies — hypothesis testing validates trends and informs policy.
Regression Analysis
Regression analysis is a statistical method used to examine how one or more variables influence an outcome. In healthcare, it is widely used to predict patient outcomes, identifyclinical risk factors, and understand which variables have the strongest impact onhealth status. It helps clinicians and researchers quantify relationships—such as how age, lifestyle, or clinical biomarkers affect disease progression or treatment response.
Today, regression models are becoming even more essential due to the rise of EHR-drivenanalytics, precision medicine, and early-risk prediction tools. Hospitals increasingly use regression-based models to predict readmission risk, sepsis likelihood, treatment response, and disease severity.
Example: Once researchers confirm that a lifestyle or treatment program is effective, the next step is to understand why it works, and which factors contribute most to improvement. They collect data from patients on variables such as:
Age
BMI
Daily exercise minutes
Diet adherence score
Stress levels
Sleep hours
Baseline blood sugar levels
Using regression analysis, they determine how strongly each variable influences the outcome (e.g., reduction in blood sugar levels). This helps clinicians identify which factors drive improvement the most and personalize care plans accordingly.
Linear Regression
Linear regression is a statistical technique used to understand how an outcome (such as blood glucose, blood pressure, or cholesterol levels) changes based on one or more influencing factors. In healthcare, it is widely used for predicting continuous outcomes, evaluating how lifestyle or clinical factors affect patient results, and identifying which variables have the strongest impact on treatment response.
Linear regression is becoming increasingly important due to the rise of precision medicine and predictive analytics, where clinicians rely on data-driven models to anticipate disease progression or treatment effects.
Example question: “How much does a patient’s blood sugar decrease for every 10 extra minutes of daily exercise?”
This helps healthcare teams quantify relationships and design more personalized interventions.
Logistic Regression
Logistic regression is used to predict the probability of an event — such as recovery, complications, readmission, or treatment of success. Instead of predicting a numeric value, it predicts outcomes like Yes/No, Success/Failure, or Disease/No Disease. This makes it essential for clinical decision-making, risk scoring, and medical diagnosis tools.
It has gained major relevance in recent years due to its use in risk prediction models, such as identifying high-risk cardiac patients, predicting ICU admissions, or assessing the likelihood of disease onset.
Example question:
“What is the probability that a patient’s blood sugar will return to normal after 8 weeks?”
This helps clinicians estimate risk, guide to treatment planning, and personalize care pathways.
Survival Analysis
Survival analysis is a statistical approach used to evaluate how long it takes for an eventtooccur, such as recovery, relapse, hospitalization, or death. In healthcare, it is crucial for time-to-event analysis in clinical trials, oncology studies, chronic disease monitoring, and treatment comparison.
This method is increasingly important as modern clinical trials, and real-world evidence studies require precise time-based evaluation of treatment effectiveness and patient outcomes.
Example questions:
“How long do blood sugar improvements last after a lifestyle program?”
“When do glucose levels begin to rise again?”
“Do patients receiving the new treatment remain stable longer?”
Inferential statistics measures
Method
Simple Meaning
Purpose
Formula (Basic)
Hypothesis Testing
Checks if differences are real or by chance
Compare two groups/treatments
t-test: t = (x̄₁ − x̄₂) / SE
Regression Analysis
Finds relationships between variables
Predict outcomes & risk
Linear: ŷ = a + bX Logistic: p = 1 / (1 + e⁻(a+bX))
Survival Analysis
Measures time until an event occurs
Estimate survival or recovery time
Kaplan–Meier: S(t) = Π (1 − d/n)
Real World Applications of Statistical Analysis in Healthcare
Descriptive Statistics in a Clinical Trial
During the COVID-19 pandemic, researchers faced an urgent challenge: understanding which patients were eligible for treatment trials and how disease severity varied across the population. The RECOVERY TRIAL, one of the world’s largest COVID-19 clinical trials, needed a structured way to analyze thousands of incoming patient records that differed widely in age, comorbidities, vitals, and severity levels.
How descriptive statistics helped: Researchers summarized key baseline characteristics such as mean age, median oxygen saturation, most common comorbidities, and the overall distribution of disease severity. These descriptive summaries allowed the team to clearly define and refine inclusion and exclusion criteria.
Outcome: Through this process, the team determined that 14,892 of 22,560 patients (66%) met the eligibility requirements—ensuring the study population was balanced, representative, and scientifically valid.
Descriptive statistics turned scattered raw data into organized, interpretable insight, forming the foundation upon which the entire clinical trial was built.
Inferential Statistics in a Clinical Trial
After defining the patient’s groups, the next challenge was determining whether a treatment actually produced meaningful clinical benefit. In the RECOVERY Trial’s aspirin arm, researchers compared two groups:
One received aspirin
The other received standard care
Although both groups showed 17% mortality after 28 days, inferential statistics were required to test whether this similarity reflected reality or was due to random variation.
Challenge:
Could aspirin reduce mortality in hospitalized COVID-19 patients?
How the study was conducted:
Researchers applied inferential statistical tools—hypothesis testing, p-values, confidence intervals, and risk ratios—to determine whether any observed difference between groups was statistically significant.
Result:
The analysis yielded a non-significant p-value, confirming that aspirin did not reduce 28-day mortality.
Based on this evidence, aspirin was not recommended as a therapeutic option for reducing mortality in COVID-19 hospitalizations. The study helped redirect global clinical guidance toward more effective interventions.
Conclusion
Statistics shifts healthcare from relying solely on intuition to functioning as an evidence-driven science. Whether defining normal physiological ranges, assessing treatment outcomes, or monitoring health trends, Statistical Analysis in Healthcare forms the backbone of modern medical research and decisions.
If this blog helped you see the value of statistical analysis, you can take the next step by building these skills properly through ours Biostatistics course. It’s designed for students who want clear, practical learning, and real healthcare examples.
Strengthen your statistical foundation today and prepare yourself for a future where healthcare decisions are powered by data.
Did you know that organizations integrating BI tools into their readmission reduction strategies have seen up to a 40% reduction in risk-adjusted readmission? This impactful statistic highlights how powerful business intelligence in healthcare is, and how it is transforming modern medical systems.
In today’s rapidly evolving healthcare landscape, data is more than just numbers; it’s the key to unlocking innovation, improving patient outcomes, and optimizing operational efficiency. To make sense of massive amounts of information, hospitals rely on business intelligence in healthcare, supported by BI tools that convert raw data into clear and meaningful healthcare insights for decision-makers.
Imagine being able to predict disease outbreaks, optimize hospital resources, or enhance patient care through the power of data. When this information reaches the right people at the right time, it turns into clear insights that guide better decisions. That is the impact of Business Intelligence in healthcare, and it is time for students like you to get on board. Whether you want to grow in life sciences, healthcare consulting, or clinical research, understanding Business Intelligence has become essential. As healthcare becomes more data-driven, professionals who can read and apply insights stand out, making BI a valuable skill for future-ready roles.
In this guide, you’ll explore what Business Intelligence is, how it works in healthcare, and how it transforms raw data into useful insights. You’ll also learn about its impact and real-world use cases that show how hospitals and health organizations use BI to improve care and efficiency. This understanding will help you see how mastering BI can strengthen your career in the evolving healthcare industry.
What is business intelligence and how it is redefining healthcare recently?
Business Intelligence in healthcare has evolved with real-time analytics, cloud platforms, AI-driven insights, and improved data integration through HL7 and FHIR. These advancements allow healthcare systems to use data faster and more accurately than ever before.
At its core, BI involves collecting, integrating, analyzing, and visualizing clinical, operational, and financial data to support better decisions. Modern tools such as Power BI, Tableau, Qlik, Snowflake, AWS HealthLake, Google Cloud Healthcare API, and Azure Health Data Services help bring together information from EHRs, lab systems, billing platforms, and medical devices.
This unified and intelligent use of data helps healthcare providers improve outcomes, manage resources effectively, and streamline everyday workflows.
Business Intelligence in Healthcare: How does it work?
Healthcare organizations implement Business Intelligence by setting up systems that bring data from different departments into one place and convert it into useful insights for clinical and administrative decisions. Once the right tools and data pipelines are in place, BI works through a simple end-to-end process.
It starts with collecting data from EHRs, lab systems, billing platforms, medical devices, and external databases. This data is then cleaned and organized in a central warehouse or cloud platform. Next, BI tools analyze the information to uncover trends, measure performance, and support predictions. Finally, the insights are displayed through dashboards and reports that help healthcare teams make informed decisions. Here’s how it works:
1. Data Collection
Data collection is the starting point of Business Intelligence in healthcare. It brings together information from EHRs, lab systems, billing platforms, medical devices, and external health databases to create a unified view of clinical and operational activity.
The process works by pulling data from every patient interaction including consultations, tests, treatments, admissions, and billing. This data is moved into a central system where it is organized and cleaned for analysis. Tools such as HL7 interfaces, APIs, ETL pipelines, and cloud platforms help automate and streamline this flow of information.
Many people contribute accurate data collection. Doctors and nurses record clinical details, lab and billing staff enter operational data, health informatics teams manage the systems, IT teams maintain the databases, and data engineers build the pipelines that connect everything. Together, they ensure that healthcare data is complete, reliable, and ready for meaningful insights.
Example: A patient visits the hospital with chest pain. The EHR collects and stores details like diagnosis (“mild cardiac ischemia”), prescribed medication, doctor’s notes, and test results. BI pulls this EHR data to track how many cardiac patients show similar symptoms each month, helping the hospital detect trends early and plan resources for cardiac care more effectively.
2. Data Preparation
Data preparation ensures that the information collected from different healthcare systems is accurate, consistent, and ready for analysis. It involves cleaning the data to remove errors and duplicates, standardizing formats across all sources, and organizing everything in centralized platforms such as data warehouses or lakehouses.
This process uses ETL and ELT pipelines, integration standards like HL7 and FHIR, and cloud tools such as Azure Data Factory, AWS Glue, Google Cloud Data Fusion, and Snowflake. These tools help automate the cleaning and transformation steps.
Several teams support this stage. Data engineers build and maintain the pipelines, health informatics specialists ensure clinical accuracy, IT teams manage the storage systems, and data stewards oversee data quality. Their combined effort ensures the prepared data is reliable for BI insights.
Example: If one department records “Hypertension” and another records “High BP,” BI tools clean and standardize these entries. Duplicate patient IDs are removed, and the cleaned data is stored in a data warehouse or cloud platform so that BI ensures this standardized data produces accurate reports and consistent insights across all departments.
3. Data Analysis
Data analysis is where prepared information is examined to uncover trends and performance indicators. BI tools analyze clinical and operational data to identify patterns such as readmission risks, treatment outcomes, workflow delays, and resource utilization. These insights help hospitals understand what is working, what needs attention, and where improvements can be made.
This stage uses tools like Power BI, Tableau, Qlik, Python, R, SAS, and cloud platforms such as Snowflake and BigQuery to run analyses and generate meaningful visuals.
Data analysts and BI specialists lead the analysis, while data scientists handle advanced modeling. Clinicians and administrators provide the context needed to ensure the findings are accurate and relevant. Together, they turn data into clear insights that guide better decision-making.
Example: BI tools analyze a year’s worth of patient data to identify why cardiology readmission rates are rising. They detect patterns such as patients returning within 30 days due to medication non-adherence or lack of follow-up appointments, BI applies these findings to help hospitals pinpoint root causes and take corrective action.
4. Data Visualization
Data visualization is the stage where complex healthcare information is converted into clear, easy-to-understand visuals. It works by taking processed data and presenting it through dashboards, charts, graphs, and interactive reports so that healthcare teams can quickly interpret trends without needing deep technical knowledge. Visualization helps users monitor performance, track patient outcomes, spot inefficiencies, and make faster decisions.
This process relies on tools such as Power BI, Tableau, Qlik Sense, Looker, and cloud-based visualization modules available in platforms like AWS, Azure, and Google Cloud. These tools allow users to drill down into metrics, compare time periods, and interact with real-time data.
BI developers and data analysts design dashboards and build reports, data scientists create visual outputs for predictive models, and clinicians or administrators review these visuals to guide decisions. Their collaboration ensures that the final dashboards are accurate, meaningful, and aligned with real healthcare needs.
Example: A Power BI dashboard displays real-time patient flow in the emergency department—showing current wait times, number of admitted patients, staff availability, and bed occupancy. Clinicians can click and drill down to see which departments are causing delays, BI turns this visual information into clear insights that make it easier to reduce bottlenecks and improve patient movement.
5. Actionable Insights
Actionable insights are the final step of the BI process, where analyzed data is translated into practical recommendations that improve patient care, optimize workflows, reduce costs, and support long-term planning. This stage focuses on turning patterns and trends into specific actions that address issues such as rising readmissions, resource gaps, or delays in patient services.
These insights are generated through BI dashboards, predictive models, automated alerts, and performance monitoring tools available in platforms like Power BI, Tableau, Qlik, SAS, and cloud analytics services. These tools help organizations move from understanding the data to acting on it.
Multiple teams contribute to making insights actionable. Data analysts and BI specialists interpret the results, clinicians and department heads validate the recommendations, administrators and operations teams implement the changes, and leadership uses these insights for strategic planning. Their combined effort ensures that insights are not just informative but are applied effectively to improve overall healthcare performance.
Example: Based on BI insights, hospital leaders discover that most ICU readmissions occur during night shifts due to reduced staffing. They increase night-duty staff and implement early-warning monitoring, BI helps measure the impact of these changes, leading to fewer readmissions, faster interventions, and better patient outcomes.
Key Business Intelligence Tools Used in Healthcare
Here are some of the key BI tools that empower healthcare professionals to analyze data and enhance patient care and operational efficiency.
Tableau
Tableau is a top BI tool in healthcare for analyzing hospital performance, patient outcomes, and financial data. Used by 36% of pharmaceutical companies’ medical information departments, learning Tableau can lead to career opportunities in data analysis, healthcare analytics, and business intelligence, with high demand for roles like Data Analyst and BI Consultant.
Qlik Sense
Qlik Sense offers advanced analytics and data visualization tools, allowing healthcare professionals to explore data and uncover insights using its associative model. With over 2,500 healthcare customers using Qlik to improve patient outcomes, reduce costs, and optimize processes, mastering Qlik Sense can lead to careers in healthcare analytics, business intelligence, and data management, with growing demand for skilled professionals in healthcare and other industries.
Power BI
Power BI supports deep health data insights for patient flow, cost trends, and clinical analysis. With healthcare generating 30% of global data, expected to rise to 36% by 2025, mastering Power BI opens career opportunities in roles like Data Analyst, Healthcare Analyst, and BI Consultant, with high demand across industries.
Sisense
Sisense is a BI platform that helps healthcare professionals analyze complex datasets, create customized dashboards, and use AI-driven analytics to optimize patient care and predict outcomes. In one case, it reduced claims of denials by 40% within 60 days. Learning Sisense opens career opportunities as a Healthcare Data Analyst, BI Developer, or Data Modelling Consultant, especially in data-driven healthcare organizations.
IBM Cognos Analytics
IBM Cognos Analytics It is a BI tool that integrates data to help healthcare organizations make informed decisions through reporting, visualization, and predictive analytics. With over 60% of healthcare organizations using BI tools, mastering Cognos Analytics opens career opportunities in roles like Healthcare BI Developer and Clinical Data Analyst, focusing on data-driven decision-making in healthcare.
Business Intelligence in Healthcare: Use Cases
Healthcare needs BI because it transforms large volumes of clinical, operational, and financial data into actionable insights. These business insights in healthcare help hospitals track patient trends, predict risks, optimize staffing, and improve resource use.
Healthcare needs BI because it helps organizations:
In Public Health & Population Health Management
Business Intelligence (BI) is essential in Public Health & Population Health Management, helping track health trends, detect disease patterns, and identify vaccination gaps. By using predictive analytics, BI forecasts epidemics and enables proactive measures, while also identifying underserved populations and chronic disease trends for better decision-making and timely interventions.
Real-World Example: Using BI in Flu Season to Manage Outbreaks and Improve Vaccine Distribution
In 2018, during a severe flu season, the state of Washington used Business Intelligence (BI) to manage and mitigate the outbreak. BI tools, in collaboration with the Washington State Department of Health, combined historical flu trends, real-time healthcare data, and weather patterns to track the flu’s spread.
By analyzing this data, the BI system predicted which regions would face severe outbreaks and identified areas with low vaccination rates and high chronic health conditions. With these insights, Washington was able to:
Deploy vaccines to high-risk areas
Increase awareness in vulnerable communities
Support healthcare providers with additional resources
The result was a significant reduction in flu-related hospitalizations and deaths, with over 1 million additional vaccinations administered, easing the strain on emergency rooms and preventing further spread of the virus.
In Financial Management & Revenue Cycle:
Business Intelligence (BI) improves financial management in healthcare by automating billing, monitoring reimbursements, and tracking insurance claims. It reduces errors, predicts claim outcomes, and provides real-time insights into aging receivables and revenue gaps. BI also identifies fraud, inefficiencies, and revenue leakage, helping healthcare providers ensure timely reimbursements and maintain financial health.
Real-World Example: BI in Action at a Large U.S. Healthcare Provider
In rural Nebraska, Phelps Memorial Health Center, a critical access hospital, was struggling with an inefficient revenue cycle, rising claim denials, and delayed reimbursements. To improve this, the hospital implemented a Business Intelligence (BI) solution from Inovalon, which automated billing workflows and provided real-time dashboards for tracking key metrics like claim yield, clean claim rate, and denial patterns.
The results were remarkable: clean claim rates soared from nearly 0% in 2017 to over 90%, accounts receivable days dropped from 55 to the low 30s, and denials decreased as errors were identified earlier in the process. With faster reimbursements and clearer financial insights, Phelps improved cash flow and freed up staff to focus on patient care.
In Regulatory Compliance & Reporting
Business Intelligence (BI) helps healthcare organizations comply with regulations like HIPAA and FDA guidelines by monitoring access to sensitive data and ensuring only authorized personnel can view it. BI automates report generation and audits, tracking key metrics like patient safety and treatment efficacy. This reduces the risk of non-compliance penalties and streamlines the audit process.
Real-World Example: BI in Action at a U.S. Hospital for HIPAA Compliance
InaU.S. hospital systemstruggled with HIPAA compliance, particularly in tracking access to sensitive patient information. Manual tracking was error-prone, making it hard to detect unauthorized access. To address this, the hospital implemented a Business Intelligence(BI) system that integrated with their Electronic Health Record (EHR) system to monitor data access in real time.
The BI tool flagged unauthorized access by a non-medical staff member, triggering an automated alert. The security team quickly investigated and prevented further breaches, avoiding a HIPAA violation. Additionally, the BI system automated compliance reporting, generating monthly reports on data access and security events, reducing manual work and ensuring timely, accurate audits.
By leveraging BI, the hospital improved data security, streamlined compliance reporting, and avoided potential penalties for HIPAA violations.
How to make a career in healthcare with Business Intelligence?
For Life Science students, Business Intelligence (BI) is becoming increasingly vital as it bridges the gap between scientific research and business decision-making. In the evolving landscape of healthcare, pharmaceuticals, and biotechnology, data-driven decisions are crucial for innovation, efficiency, and patient outcomes. By mastering business insights in healthcare, Life Science students can analyze vast amounts of medical, clinical, and operational data, enabling them to make informed decisions that drive advancements in healthcare. BI empowers students to not only understand trends and patterns but also to predict future needs and optimize resources, enhancing their value in both research and industry roles.
Incorporating BI into their skill set opens doors to a range of career opportunities, from clinical data analysis to healthcare consulting and beyond. It provides Life Science students with a competitive edge, allowing them to contribute meaningfully to organizations that rely on data for success.
We understand the importance of these skills and designed a course Professional certificate in Healthcare Data Management to equip students with the BI tools needed to excel in the life science industry, ensuring they are prepared for the demands of an evolving healthcare landscape.
The integration of wearables in clinical trials marks a shift from traditional site-based studies to decentralized trials (DCTs). Decentralized Clinical Trials (DCTs) are a modern approach to clinical research where data collection, patient monitoring, and even interventions take place remotely, away from traditional clinical sites. Instead of requiring patients to visit research centers for every follow-up, DCTs leverage digital technologies, enabling participants to engage with the trial from their own homes.
In DCTs, wearables capture longitudinal data from participants in their natural environment, offering granular insights into how treatments evolve. For example, CGMs provide continuous glucose readings every 5 minutes, generating over 288 data points per day, while smartwatches track heart rate variability, sleep, and activity, producing millions of data points over time. This 24/7 monitoring enhances the accuracy and comprehensiveness of clinical data compared to traditional methods.
However, managing the large volume of data from wearables presents challenges. A study using Empatica E4 wristbands to monitor stress collected over 1.2 million data points per participant. The challenge is not just collecting data but integrating it across platforms while ensuring it meets regulatory standards, like FDA 21 CFR Part 11.
Data Science in Managing Wearable Data Streams
Wearables in clinical trials are the digital backbone of decentralized clinical trials (DCTs), providing continuous data on heart rate, blood pressure, oxygen saturation, and glucose levels. These devices enable real-time data analysis, helping researchers make quicker, data-driven decisions and adapt trial protocols based on changes in patient health.
However, the large volume of data generated by wearables presents challenges. For instance, a CGM like the Dexcom G6 can produce 28,800 glucose readings per month, requiring robust cloud-based platforms to process and analyze the data in real-time. Data consistency is also crucial—issues like inconsistent heart rate readings from a smartwatch can compromise data integrity, making automated validation checks essential to ensure accuracy and regulatory compliance.
A key advantage of wearables in DCTs is predictive modeling. With AI algorithms, real-time data from CGMs can be used to assess treatment efficacy and adjust protocols dynamically. Similarly, activity trackers provide insights into exercise interventions in cardiovascular trials, offering real-world data that traditional site-based methods can’t match.
Wearables in clinical trials are transforming the landscape of clinical trials by enabling continuous, real-time data collection from patients outside of traditional clinical settings. These devices are worn by participants to monitor a wide range of physiological and behavioral data in their everyday environment. Below are five wearable devices that are increasingly being used in clinical research:
Continuous Glucose Monitors (CGMs)
Data Collection: CGMs, like the Abbott FreeStyle Libre and Dexcom G7, continuously collect glucose readings throughout the day and night. These devices use small sensors that track interstitial fluid glucose levels, providing real-time data every few minutes. For example, the Dexcom G6 can generate 28,800 glucose data points per month. This real-time data is transmitted wirelessly to a smartphone or wearable device, offering a complete picture of glucose fluctuations.
Data Usage: This continuous data allows researchers to observe glucose trends over time, making it possible to understand how patients respond to diabetes medications or lifestyle interventions in real-world settings. The data provides insights into glycemic variability, which is a crucial factor in evaluating treatment efficacy. It also enables researchers to adjust treatment protocols in real time based on patients’ daily glucose fluctuations, improving treatment outcomes and patient safety.
Impact: By enabling continuous monitoring, CGMs reduce the need for frequent clinic visits, making trials more patient-friendly. This real-time data improves the accuracy and granularity of the information collected, offering richer insights into the effectiveness of treatments and patient responses over longer periods of time. In the PROGRESS study, 73% of participants provided usable data, showing the feasibility and effectiveness of remote monitoring in decentralized trials.
Medical-Grade Vital Sign Patches
Data Collection: Medical-grade biosensors like the BioIntelliSense BioSticker and VitalConnect VitalPatch collect data on vital signs such as heart rate, respiratory rate, skin temperature, and movement. These devices are typically worn on the chest or upper arm, offering long-term data collection — from days to weeks — without the need for site visits. The data is automatically transmitted to cloud-based systems where it can be analyzed by research teams.
Data Usage: The continuous stream of data collected from these patches allows researchers to track physiological changes in real time. For instance, in post-surgical trials, these devices can identify early signs of complications like respiratory distress or abnormal heart rate fluctuations, enabling researchers to intervene before more serious problems arise. The continuous, remote monitoring makes it possible to track patients’ health without frequent clinic visits, significantly improving patient comfort and adherence.
Impact: This data collection is especially valuable in clinical areas where continuous monitoring is essential but mobility is limited, such as in cardiac monitoring, oncology, and chronic disease management. A study using the Leenen et al. (2023) feasibility study demonstrated that biosensor patches could capture 99% of the required vital-sign measurements remotely, showing their effectiveness in capturing hospital-grade data without requiring patients to visit clinical sites.
Research-Grade Smartwatches and Wristbands
Data Collection: Research-grade smartwatches like the Verily Study Watch and Empatica E4 collect a variety of data, including ECG readings, heart rate variability (HRV), electrodermal activity (EDA), sleep patterns, and physical activity. These devices use built-in sensors to continuously monitor and record physiological responses in real time. The Empatica E4, for example, tracks EDA (a measure of stress), motion, and skin temperature.
Data Usage: Researchers use this data to track subtle physiological changes that could indicate the onset of disease or the impact of a treatment. For example, HRV and EDA are key indicators of stress or autonomic nervous system function, making them useful in studies of neurological conditions or mental health. Sleep tracking can help researchers monitor how treatments affect rest cycles and overall well-being, while activity data can provide insights into physical health and exercise interventions.
Impact: These devices provide continuous, high-resolution data that enables early symptom detection and predictive insights. The data can be used to track the effectiveness of medications or therapies in real time. In a study led by Empatica, the E4 wristband detected over 90% of seizure-related events, proving that wearables can achieve clinical-grade accuracy in real-world conditions.
Actigraphy Devices
Data Collection: Actigraphy devices like the Actiwatch and GENEActiv continuously track sleep-wake cycles and physical activity. These wrist-worn devices use motion sensors to measure activity levels and rest periods, providing valuable data on sleep quality, circadian rhythms, and fatigue. The GENEActiv can track raw motion data for long durations, making it ideal for longitudinal studies.
Data Usage: This data is particularly useful in studies that monitor sleep disorders, neurological conditions, or behavioral health. For instance, it helps researchers understand fatigue patterns and sleep disturbances in patients with Parkinson’s disease, insomnia, or chronic fatigue syndrome. By monitoring activity and rest periods, actigraphy data also provides insights into how lifestyle interventions or medications affect circadian rhythms and overall well-being.
Impact: By providing objective, continuous data on sleep and activity, actigraphy devices help researchers detect early signs of disease progression or treatment efficacy. In a 2021 multicenter study on Parkinson’s disease, actigraphy data helped identify early disruptions in movement and sleep, showcasing its ability to uncover meaningful biomarkers that traditional methods might miss.
Smart Clothing and Textiles
Data Collection: Smart textiles, like the Hexoskin Smart Shirt and Chronolife Smart Vest, integrate sensors directly into fabrics to measure vital signs such as heart rate, respiration, and muscle activity. These garments continuously collect physiological data without restricting comfort or mobility, making them ideal for long-term monitoring in rehabilitation, sports medicine, and chronic disease trials.
Data Usage: Researchers use data from smart textiles to monitor respiratory patterns, heart rate during exercise, and muscle activity during rehabilitation. For example, the Hexoskin Smart Shirt tracks breathing patterns during physical activity, allowing researchers to assess the effectiveness of cardiac treatments or respiratory therapies. Similarly, the Chronolife Smart Vest captures ECG data, helping researchers monitor heart health in cardiovascular studies.
Impact: Smart textiles enable seamless, continuous monitoring in natural, real-world settings. This makes them especially valuable for trials that require long-term, real-time data without interrupting daily life. Studies like the 2024 MDPI Sensors review have shown how smart textiles are moving from concept to clinical validation, proving their ability to integrate comfort with clinical accuracy.
Conclusion:
The integration of wearables in clinical trials has unlocked vast amounts of real-time, continuous data, providing researchers with unprecedented insights into patient health. However, managing this data is no small task. The sheer volume of information, from glucose readings to heart rate variability, requires robust cloud-based platforms and advanced data management tools to ensure seamless processing, analysis, and storage. While challenges like data consistency and regulatory compliance remain, the ability to leverage predictive modeling and AI-driven insights offers powerful solutions. As wearables continue to shape the future of clinical trials, effective data management will be key to maximizing the potential of these technologies, driving faster decisions, and improving patient outcomes.
The Advanced Diploma in Clinical Research at CliniLaunch, equips you with the knowledge to navigate wearables and decentralized trials, giving you a fresh perspective on data-driven research and how technology is transforming clinical studies.
India’s med-tech sector (medical devices) currently accounts for approximately 1.65% of the global market share, but it is expected to capture 10‑12% globally within the next 25 years. The global medical devices market was valued at USD 542.21 billion in 2024 and is projected to reach USD 886.68 billion by 2032, growing at a CAGR of 6.5%. This remarkable growth is fueling a huge demand for fresh talent in the biomedical and life sciences sectors.
The rise of new startups and the expansion of established biomedical companies in India have created an increasing number of job openings for freshers across a wide range of roles. From biomedical engineering and clinical trials to bioinformatics and drug discovery, life science professionals are sought after to help power this transformative industry. Freshers can expect abundant opportunities across sectors such as R&D, manufacturing, and regulatory affairs, with many biomedical companies and medical device manufacturers actively recruiting.
In this blog, we’ll highlight the Top 10 biomedical companies hiring freshers leading India’s innovation in healthcare and medical technology, offering job vacancies for biotechnology freshers with competitive salaries and career opportunities for fresh graduates to join this booming industry.
1. Abbott India
Abbott is a global healthcare leader with over 130 years of history, operating in more than 160 countries. In India, Abbott is a key player in diagnostics, medical devices, nutrition, and branded generic medicines. With a strong presence in over 10 locations and serving over 24,000 clinicians, Abbott India is committed to providing innovative healthcare solutions. The company is particularly recognized for its contributions to diabetes care, cardiovascular health, and nutrition.
Notable Innovation
Abbott’s FreeStyle Libre continuous glucose monitoring (CGM) system stands out as a pioneering innovation in diabetes care. With over 5 million users worldwide, the system has revolutionized glucose monitoring by eliminating the need for routine fingerstick testing. Its small, wearable sensor provides real-time glucose level data, making it one of the most advanced diabetes management tools globally.
Why It’s Best for Freshers
Abbott India offers biomedical job vacancy for fresher with structured early‑career programmes and trainee roles aimed at graduates with 0‑2 years of experience. The company provides exposure to multiple domains (R&D, devices, diagnostics, manufacturing) and fosters learning, global exposure and mentorship. For freshers, this means a strong platform to build a career in biomedical/medical‑devices/healthcare rather than just a routine job.
Company Snapshot
Category
Details
Company Size
~12,000+ employees in India across its business operations.
What They Do
Diagnostics, medical devices, nutrition, branded generics & pharmaceuticals.
Locations
Headquarters in Mumbai; manufacturing & operations across India (Goa, Baddi etc.)
Structured early‑career programmes, exposure across healthcare/devices, global brand, innovation culture.
2. GE HealthCare
GE HealthCare is a global leader in medical imaging, digital healthcare, and diagnostics, operating in more than 100 countries. The company invests over $1B annually in R&D, driving innovation in technologies that improve patient outcomes. GE HealthCare’s solutions are used in more than 259,000 patients daily, with 4 million imaging, mobile, diagnostic, and monitoring devices deployed worldwide. The company manages over 2 billion patient scans annually, making it a key player in the healthcare industry.
Notable Innovation
GE HealthCare’s Revolution Apex CT scanner provides advanced imaging capabilities, improving diagnostic accuracy and enabling faster, more precise medical assessments. This cutting-edge technology enhances oncology and cardiovascular diagnostics, improving patient care across various clinical settings.
Why It’s Best for Freshers
GE HealthCare is one of the top biomedical companies hiring freshers that offers early-career programs, including Engineer Trainee roles, for freshers to gain exposure to advanced medical imaging, diagnostics, and healthcare technologies. The company’s culture of innovation, strong training programs, and focus on mentorship provide freshers with a strong foundation to build a career in the healthcare technology sector.
Company Snapshot
Category
Details
Company Size
~50,000+ employees globally
What They Do
Medical imaging, digital healthcare, diagnostics, software solutions.
Locations
Operations across India, including Bengaluru, Hyderabad, and Mumbai.
Biotech Engineers, Clinical Application Specialists, Medical Imaging Specialists.
Salary Range
Entry-level roles- ₹4–8 LPA for freshers.
3. Medtronic
About the Company
Medtronic is a global leader in medical technology, providing innovative products and therapies to treat chronic diseases and enhance patient care. With over 150,000 employees across 160+ countries, the company operates 350,000+ square feet of facility space and employs 1,400+ engineers. Medtronic has contributed significantly to medical advancements, holding 200+ patents and 500+ IP disclosures globally.
Notable Innovation
Medtronic’s MiniMed™ 670G insulin pump is the world’s first hybrid closed-loop system for diabetes management, automatically adjusting insulin levels based on real-time glucose readings. This revolutionary product has significantly improved the lives of people with diabetes, offering a more automated and precise approach to insulin delivery.
Why It’s Best for Freshers
Medtronic offers entry-level roles that provide freshers with hands-on experience in medical technologies. With exposure to state-of-the-art labs and a collaborative environment, freshers can develop skills, gain mentorship, and contribute to advancements in healthcare solutions.
Company Snapshot
Category
Details
Company Size
~95,000 employees globally
What They Do
Medical devices, therapies, R&D, diabetes management, heart solutions, surgical technologies.
Locations
Facilities in key regions globally, including India (Bangalore, Delhi).
Notable Work
MiniMed™ 670G insulin pump – hybrid closed-loop system for diabetes management.
Offers early-career programs, access to state-of-the-art labs, strong mentorship culture, global opportunities.
4. Pfizer
About the Company
Pfizer is a global biopharmaceutical giant with approximately 81,000 employees worldwide and operations in roughly 200 countries and territories. In 2025, the company reported revenues of about US $45 billion and has over 100 projects in its development pipeline. Pfizer’s medicines and vaccines reached more than 414 million patients in 2024 alone.
Notable Innovation
Pfizer is best known for its work in vaccine development, especially the Pfizer-BioNTech COVID-19 vaccine, which played a pivotal role in combating the global pandemic.
Why It’s Best for Freshers
Pfizer is one of the leading biomedical companies hiring freshers, that offers entry level biomedical engineering positions with comprehensive graduate program that provides freshers with opportunities to work in R&D, clinical trials, manufacturing, and regulatory affairs. Freshers gain hands-on experience and mentorship, contributing to innovative pharmaceutical technologies.
Global pharmaceutical leader, structured trainee/graduate programmes, diverse roles in R&D and manufacturing
5. AstraZeneca
About the Company:
AstraZeneca is a global biopharmaceutical company focusing on oncology, cardiovascular, and respiratory diseases. With a commitment to discovering and developing life-changing medicines, AstraZeneca operates in over 100 countries globally. AstraZeneca Pharma India posted ₹1,330 crore in revenue for FY 2023‑24, marking a 29% growth over the previous year.
Notable Innovation
AstraZeneca’s Imfinzi is a breakthrough immunotherapy used to treat various types of cancer, marking a major advancement in cancer care.
Why It’s Best for Freshers
AstraZeneca offers job vacancies for biotechnology freshers with early-career opportunities in drug discovery, clinical trials, manufacturing, and regulatory affairs. The company’s rotational programs allow freshers to gain diverse experiences and develop their careers in the pharmaceutical industry.
AstraZeneca plc
Category
Details
Company Size
~94,300 employees globally as of Dec 2024
What They Do
Global biopharmaceuticals focused on oncology, cardiovascular, respiratory, and immunology
Locations
Global operations with major R&D & manufacturing sites across continents
Notable Work
Achieved US$54+ billion in revenue in 2024; significant employee base
Roles Hiring
Drug Discovery Analysts, Clinical Data Specialists, Quality & Regulatory Trainees
Salary Range
Entry-level roles with ~₹4–9 LPA (varies by role)
Why It’s Best for Freshers
High-impact global pharma company, major growth trajectory, opportunity in cutting-edge therapies
6. GSK
About the Company
GSK is a global healthcare company with a strong focus on vaccines, biopharmaceuticals, and consumer healthcare products. GSK operates in 75 countries and has 37 manufacturing sites globally. They are committed to improving the quality of human life by enabling people to do more, feel better, and live longer.
Notable Innovation
GSK’s Shingrix vaccine is a leading preventive measure against shingles, setting new standards in vaccine development for older adults.
Why It’s Best for Freshers
GSK offers a range of graduate programs and rotational opportunities in R&D, clinical trials, and manufacturing. Freshers have the opportunity to work with cutting-edge technologies and receive mentorship from industry leaders, contributing to global healthcare solutions.
BiomedicalAnalysts, Vaccine Development Engineers, Regulatory Affairs Trainees
Salary Range
Entry‑level roles with ~₹4–9 LPA (varies by role)
Why It’s Best for Freshers
Large global biopharma player, strong R&D investment, broad exposure across vaccines and specialty medicines
7. Siemens Healthineers
About the Company
Siemens Healthineers is a global leader in medical imaging, diagnostics, and laboratory diagnostics. With a strong presence in over 70 countries, Siemens Healthineers focuses on helping healthcare providers deliver precise, patient-centered care through cutting-edge technologies and digital innovations.
Notable Innovation
Siemens Healthineers’ SOMATOM® go.Now CT scanner is a state-of-the-art imaging system that integrates AI to enhance diagnostic accuracy and improve efficiency in hospitals.
Why It’s Best for Freshers
Siemens Healthineers offers entry-level programs and rotational opportunities in medical imaging, diagnostics, and IT solutions. Freshers gain exposure to advanced healthcare technologies and have the chance to work in an innovative environment with hands-on training and mentorship.
Company Snapshot
Category
Details
Company Size
~60,000 employees globally
What They Do
Medical imaging, diagnostics, IT solutions, and laboratory diagnostics
Locations
Operations across 70+ countries, including India (Bangalore, Mumbai)
Offers training, exposure to cutting-edge imaging technologies, and global career opportunities
8. Baxter International
About the Company
Baxter International is a global med‑tech leader operating in more than 100 countries, with over 90 years of experience in healthcare innovation. They specialize in medical devices, biopharmaceuticals, and hospital supplies. The company’s products help treat and manage critical diseases such as kidney failure and immune system disorders, with a focus on improving the lives of patients in 100+ countries.
Notable Innovation
Baxter is known for its innovations in dialysis and IV solutions. Their AK 98 hemodialysis machine is one of the leading systems for renal care, providing efficient treatment and improving patient quality of life.
Why It’s Best for Freshers
Baxter provides freshers with a range of opportunities in manufacturing, quality assurance, and regulatory affairs. The company offers structured programs with training and exposure to the healthcare device manufacturing sector.
Company Snapshot
Category
Details
Company Size
~50,000 employees globally
What They Do
Medical devices, hospital supplies, biopharmaceuticals
Locations
Operates in 100+ countries, including major locations in India
Notable Work
Innovators in kidney dialysis, IV solutions, and hospital care equipment
Large global company with structured roles in medical device manufacturing and quality control
9. Bosch Healthcare India
About the Company
Bosch India’s Med-Tech division was founded in 2015 and is a wholly‑owned subsidiary of Robert Bosch GmbH. It focuses on innovative solutions in the healthcare space, combining its expertise in engineering, digital systems, and medical devices to improve patient care and hospital operations. Bosch is a global leader in automotive technology and industrial products, now bringing its expertise into the healthcare market. Their diagnostic platform Vivalytic offers rapid PCR testing and can process 5 samples simultaneously in 39 minutes.
Notable Innovation
Bosch has developed the Vivalytic rapid-PCR diagnostic platform for faster testing and results, and its hemoglobin monitoring technology uses optical spectroscopy, revolutionizing diagnostic capabilities.
Why It’s Best for Freshers
Bosch offers exciting opportunities for freshers in biomedical engineering, software systems, and medical devices. The company’s focus on engineering and innovation offers freshers the chance to work at the intersection of healthcare and cutting-edge technology.
Category
Details
Company Size
~30,000 employees in India (across all divisions) (bosch.in)
What They Do
Automotive technology, industrial equipment, and medical devices
Locations
Operations in India (Bangalore, Nashik, and other locations)
Notable Work
Focus on innovative medical technology applications within their industrial product range
Roles Hiring
Biomedical Engineers, Product Engineers, Service Engineers
Salary Range
Entry-level roles with ~₹4–7 LPA for freshers
Why It’s Best for Freshers
Innovative engineering company with strong presence in Med-Tech; great for freshers in tech roles
10. Meril Life Sciences
About the Company
Meril Life Sciences founded in 2006, is an Indian medical device manufacturer known for developing biomedical implants, cardiovascular devices, and orthopedic solutions. The company focuses on providing high-quality, affordable medical devices for global markets and is committed to enhancing patient care.
Notable Innovation
Meril’s Myval transcatheter heart valve is a breakthrough in minimally invasive cardiovascular surgery, improving the outcomes and recovery for heart patients.
Why It’s Best for Freshers
Meril Life Sciences offers freshers direct opportunities in medical device design, manufacturing, and quality assurance. The company’s fast-growing environment provides great learning experiences and exposure to both domestic and international markets.
Fast-growing medical device manufacturer offering direct opportunities in design, manufacturing, and quality
Conclusion
With the rapid growth of India’s biomedical and med-tech industries, there has never been a better time for freshers to enter the field. Thousands of companies across the country are actively hiring new talent, creating ample job opportunities in research, development, manufacturing, and clinical roles.
Moreover, these companies are committed to investing in their future workforce, providing structured training programs, internships, and mentorship opportunities to help fresh graduates build their careers. From gaining hands-on experience with cutting-edge technologies to working on groundbreaking healthcare solutions, freshers are given the tools and support they need to succeed. As the demand for skilled professionals continues to rise, the biomedical sector remains an exciting and dynamic career path.
At CliniLaunch, we are dedicated to training freshers and equipping them with the practical knowledge and hands-on experience required to succeed in the biomedical sector. Our comprehensive programs ensure that freshers are well-prepared for real-world challenges and can make an immediate impact in their roles.
If you’re a fresher with a passion for life sciences and medical technology, now is the perfect time to explore these biomedical companies hiring freshers and take your first step into a thriving, impactful career.