
Who is a Statistical Modeling Associate?
A Statistical Modeling Associate is a professional who applies statistical methods using software tools to analyze data, build and validate models, and interpret results. They work with structured datasets to support research, business, or healthcare decisions, ensuring accuracy, reproducibility, and clear documentation of statistical findings.
Many learners understand statistical concepts but struggle to see how statistical modeling is applied in real industry roles. The missing link is often the statistical analysis software used to execute those concepts in practical workflows. A Statistical Modeling Associate relies on specific statistical analysis software to manage data, build and validate statistical models, and prepare clear, auditable documentation for stakeholders.
Understanding these tools provides a realistic view of the role’s day-to-day responsibilities and industry expectations, especially in regulated environments that rely heavily on data analysis tools in healthcare and research analytics. The following sections outline the key statistical software tools used by Statistical Modeling Associates, organized according to their purpose within the statistical analysis workflow, from data preparation to final reporting.
These statistical software tools allow analysts to perform modeling, validation, visualization, and reporting with accuracy and reproducibility.
Trusted by 10,000+ learners in healthcare analytics
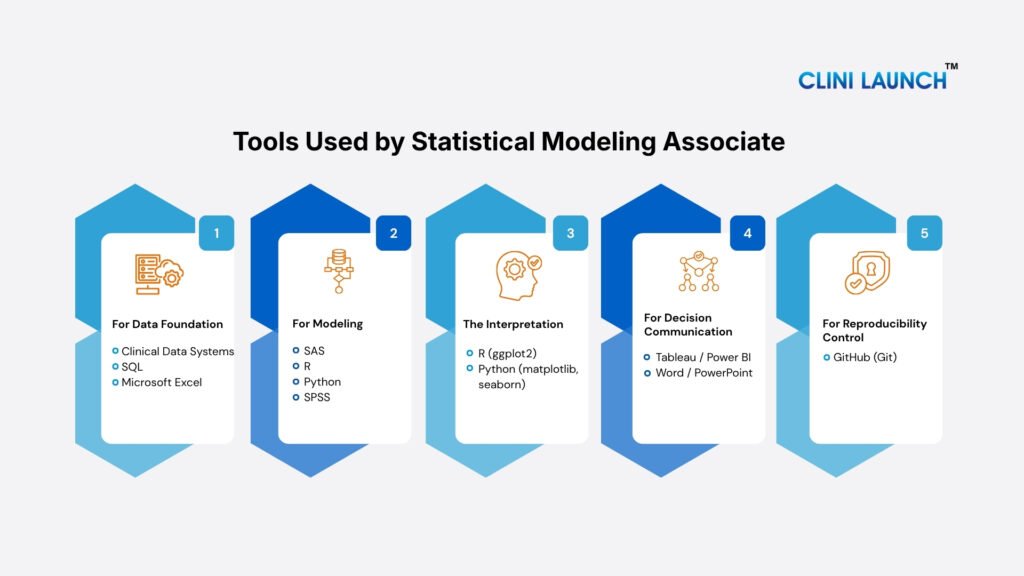
Top tools used by Statistical Modeling Associate
A Statistical Modeling Associate uses a range of tools used in statistical modeling to apply statistical methods to real-world data. Along with commonly used analysis tools, the role may also involve advanced tools that support complex modeling, structured validation, and regulated reporting environments. These advanced tools help handle more sophisticated statistical methods such as mixed models, survival analysis, and workflow automation. Understanding the tools used in statistical modeling helps professionals connect statistical theory with real-world analytical workflows.
In industries like clinical research and healthcare analytics, using both standard and advanced tools ensures accuracy, reproducibility, and clear documentation. Understanding these tools provides a realistic picture of how statistical concepts are applied in professional settings.
A. Core Statistical & Modeling Tools (Primary)
These tools are directly used by Statistical Modeling Associates to build, validate, and interpret statistical models and form the core of analytical work.
1. SAS- Statistical Software for Data Analysis
SAS is a widely used SAS tool for data analysis that helps manage large datasets and perform reliable statistical analysis. It helps users run calculations, apply statistical tests, and generate accurate outputs from structured data. The software is designed to handle complex datasets without manual errors. It also ensures that results are consistent and reproducible.
For a Statistical Modeling Associate, SAS is critical because it supports regression analysis, survival analysis, and model validation. The role often involves working with regulated data where accuracy matters. SAS provides built-in procedures that reduce mistakes in statistical execution. This makes it a trusted tool for professional statistical modeling.
In a clinical trial, a Statistical Modeling Associate uses SAS to analyze patient response data across treatment groups. The software helps calculate the efficacy of endpoints and safety statistics. These results support clinical decisions and regulatory submissions. The analysis must be precise and auditable.
SAS is widely used in pharmaceutical companies, CROs, clinical research organizations, healthcare analytics firms, and insurance companies. It is especially dominant in regulated environments where compliance is mandatory. Because of its reliability and regulatory compliance, SAS is considered a leading SAS tool for data analysis in pharmaceutical and clinical research environments.
2. R for Statistical Analysis and Visualization
R is a programming language built specifically for statistical analysis and data visualization. It allows users to apply statistical models and create clear graphical outputs. R is flexible and supports many types of statistical methods. It is especially strong in exploring and interpreting data.
Statistical Modeling Associates use R to build models, test hypotheses, and understand relationships in data. It helps them visualize results in a way that supports interpretation. R also allows customization of statistical analysis of workflows. This makes it valuable for analytical and research-driven teams.
In healthcare analytics, R programming is used to analyze patient outcome data and identify trends across populations. Analysts use it to generate plots that explain model results to researchers. These insights support evidence-based decisions. Visualization plays a key role here. Tools like R are widely considered important data analysis tools in healthcare for analyzing clinical outcomes and population trends.
R is commonly used in academic research, healthcare analytics, epidemiology studies, and some pharmaceutical analytics teams. It is popular in environments that value statistical depth and flexibility. Because of its flexibility, R is widely recognized as statistical software for research in academic and healthcare environments.
3. Python for Statistical Analysis
Python is a general-purpose programming language used for data handling and analysis. It helps clean, organize, and process large datasets efficiently. Python also supports statistical testing and modeling through Python statistical libraries such as NumPy, SciPy, and Statsmodels. It is often used when automation is required.
A Statistical Modeling Associate uses Python to prepare data before modeling and apply classical statistical methods. It reduces manual effort when working with large datasets. Python is especially useful when multiple datasets need repeated processing. It supports faster and cleaner workflows.
In a healthcare analytics project, Python is used to clean patient records and prepare analysis-ready datasets. Statistical tests are then applied to understand trends. The cleaned data is later used for formal modeling. Automation saves significant amounts of time.
Python is used in healthcare analytics firms, research organizations, data-driven companies, and teams that combine statistics with data engineering.
4. SPSS Statistical Software for Research
SPSS is a statistical software that allows users to perform analysis through a graphical interface. It supports descriptive statistics, hypothesis testing, and basic modeling. Users can run analysis without heavy programming. This makes it easy to learn and apply.
Statistical Modeling Associates may use SPSS for quick statistical analysis and summary reporting. It is helpful when coding expertise is limited or not required. SPSS allows for fast execution of standard statistical tests. This supports efficient analysis in simpler studies.
In hospital-based research, SPSS is used to analyze patient survey data and treatment outcomes. Analysts generate statistical summaries for medical teams. The results help understand care effectiveness. Speed and simplicity are key advantages.
SPSS is widely used in hospitals, universities, public health research, and social science studies. It is less common in large pharma modeling teams but still relevant in healthcare research.
These platforms are widely recognized as essential statistical modeling software used across research, healthcare analytics, and data-driven industries. SPSS is also commonly used as statistical software for research, particularly in public health and university studies.
Clinical Research
Build practical skills in clinical data analysis and reporting using SAS, aligned with regulatory standards used in clinical trials. Learn how clinical trial data is cleaned, analyzed, and presented for regulatory submissions and study reporting.
B. Data Handling & Pre-Processing Tools (Supporting)
Before any modeling begins, data must be extracted, checked, cleaned, and structured using the following supporting tools.
5. Microsoft Excel
Microsoft Excel is a spreadsheet tool used to organize, review, and summarize data. It supports basic calculations, tables, and descriptive statistics. Excel helps users visually inspect datasets. It is often the first tool used in analysis.
Statistical Modeling Associates rely on Excel to perform initial data checks. It helps identify missing values, inconsistencies, before modeling. Excel is also used to cross-check results from statistical software. This improves accuracy and confidence.
Before running models in SAS or R, analysts review datasets in Excel to ensure data quality. They may calculate summary statistics to verify inputs. This step prevents errors later in modeling. It is a critical quality control step.
Excel is used across all industries, including pharma, healthcare, research, analytics, and corporate environments. It is universally accepted and unavoidable.
6.SQL (Structured Query Language)
SQL is a language used to access and manage data stored in databases. It allows users to retrieve specific data by filtering, sorting, and combining tables. SQL works efficiently with large volumes of structured data. It prepares raw data for further analysis.
A Statistical Modeling Associate uses SQL to extract the right dataset before starting statistical analysis. It helps reduce dependency on data teams for basic data access. SQL ensures analysts work only with relevant and accurate data. This makes the modeling process faster and more reliable.
In a healthcare analytics project, SQL is used to collect patient records from hospital databases. The extracted data is then cleaned and analyzed using SAS or R. This step ensures only valid records are included. SQL acts as the first step in the analysis workflow.
SQL is widely used in healthcare analytics firms, insurance companies, research organizations, hospitals, and enterprises that store data in databases. It is common wherever structured data is involved.
7.Clinical Data Systems
Clinical data systems are platforms used to collect, store, and manage data from clinical trials or healthcare settings. They organize patient data, lab results, and study records in a structured way. These systems ensure data integrity and traceability. They are not used for modeling directly.
Statistical Modeling Associates rely on clinical data systems as the source of analysis-ready data. They typically receive cleaned or locked datasets from these systems. Understanding how data is sourced helps ensure correct interpretation. This reduces errors during statistical analysis.
In a clinical trial, patient data is collected and managed within a clinical data system. Once the data is finalized, it is exported for statistical analysis. The associate then applies models using SAS or R. Accurate sourcing is critical for valid results.
Clinical data systems are used in pharmaceutical companies, CROs, clinical research organizations, hospitals, and research institutions conducting clinical studies. They are standard in regulated clinical environments.
C. Statistical Data Visualization Tools & Reporting Tools
These tools act as statistical reporting tools that translate statistical results into visual formats that support interpretation and communication with stakeholders. These statistical data visualization tools help analysts translate numerical outputs into interpretable visual insights.
8.R (ggplot2)
ggplot2 is a visualization package in R used to create clear and structured graphs. It helps turn statistical results into visual patterns like trends, distributions, and comparisons. The visuals are customizable and easy to interpret. It supports consistent and reproducible plots.
A Statistical Modeling Associate uses ggplot2 to visually interpret model outputs. Graphs help check assumptions and understand relationships in data. Visuals also make complex statistical results easier to explain. This improves clarity during analysis and reporting.
In healthcare analytics, ggplot2 is used to visualize treatment outcomes across patient groups. Analysts plot trends and distributions to support statistical conclusions. These visuals help researchers understand results quickly. They often accompany model outputs.
ggplot2 is widely used in academic research, healthcare analytics, epidemiological studies, and analytics teams that use R for statistical modeling.
9.Python Statistical Libraries (matplotlib, seaborn)
Matplotlib and seaborn are Python libraries used to create charts and statistical plots. They help visualize distributions, trends, and relationships in data. These tools convert numerical outputs into understandable visuals. They are often used alongside Python-based analysis.
Statistical Modeling Associates use these libraries to visualize results when Python is part of the workflow. Visual checks help confirm model behavior and data patterns. They also support quick exploratory analysis. This makes interpretation more effective.
In a healthcare data project, Python visualizations are used to examine patient data trends before and after modeling. Analysts generate plots to support findings. These visuals help validate assumptions. They also support internal reviews.
These tools are used in healthcare analytics firms, research organizations, and teams that rely on Python for data processing and analysis. Many Python statistical libraries simplify statistical computation and help automate complex analytical workflows.
10.Tableau / Power BI
Tableau and Power BI are visualization tools used to create dashboards and interactive reports. They present data in a visual and easy-to-understand format. These tools focus on communication rather than analysis. They help summarize results clearly.
Statistical Modeling Associates use these tools to communicate findings to non-technical stakeholders. Dashboards help present key outcomes without exposing complex statistics. They are used selectively, not daily. Their value lies in the presentation.
After completing statistical analysis, results may be shared through dashboards. Stakeholders view summarized trends and key metrics. This helps decision-makers understand outcomes quickly. The modeling remains separate from visualization.
Tableau and Power BI are used across healthcare organizations, pharma companies, corporate analytics teams, and enterprises for reporting and stakeholder communication. These dashboards act as effective statistical reporting tools for communicating complex analytical insights to stakeholders.
D. Version Control & Documentation Tools
Statistical modeling work also requires proper version control and clear documentation to ensure accuracy, traceability, and effective reporting.
11.GitHub (Git)
GitHub is a platform that uses Git to track changes in code and analysis files. It helps store scripts, manage versions, and record updates over time. Changes can be reviewed and reversed if needed. This prevents loss of work and confusion.
A Statistical Modeling Associate uses Git to maintain clean and reproducible analysis of workflows. It helps track model changes and ensures consistency across team members. Version control reduces errors caused by overwriting files. This supports collaborative and reliable analysis.
In a team-based analytics project, multiple analysts work on the same statistical scripts. GitHub records each update and keeps versions organized. If an issue arises, previous versions can be restored. This improves quality control.
GitHub is used in healthcare analytics teams, research organizations, data science groups, and modern analytics environments that emphasize collaboration and reproducibility.
12.Microsoft Word / PowerPoint
Microsoft Word and PowerPoint are used to document and present analysis results. They help organize text, tables, and visual outputs in a structured format. These tools turn statistical results into readable content. They support clear communication.
Statistical Modeling Associates use these tools to explain findings to non-technical stakeholders. Models and numbers must be translated into insights. Clear documentation ensures results are understood correctly. This is a critical part of the role.
After completing statistical analysis, results are summarized in reports or presentations. These documents explain objectives, methods, and outcomes. Stakeholders rely on them for decision-making. Communication completes the analysis process.
Microsoft Word and PowerPoint are used across pharmaceutical companies, CROs, hospitals, research institutions, and corporate analytics teams for reporting and presentations.
Basic and Advanced Tools Used by a Statistical Modeling Associate
Tools Used in Statistical Modeling
Basic Tools
Advanced Tools
Choosing the right statistical tool is essential for effective data analysis, as each software offers unique strengths depending on the type of work and industry requirements.
Hands-on learning with expert mentorship
Statistical Modeling Tools Comparison
Skills Required for a Statistical Modeling Associate
Beyond software tools, a Statistical Modeling Associate must develop strong technical and analytical skills to apply statistical concepts correctly and responsibly.
1. Statistical Knowledge
A solid understanding of regression analysis, hypothesis testing, survival analysis, ANOVA, and probability is essential. The associate must know not only how to run models but also how to interpret assumptions, validate outputs, and identify errors.
2. Data Handling & Cleaning
The ability to review datasets, identify inconsistencies, manage missing values, and prepare analysis-ready data is critical. Clean data forms the foundation of reliable statistical modeling.
3. Programming & Analytical Thinking
Working knowledge of statistical programming languages such as SAS, R, or Python is important. Logical thinking helps in structuring workflows, debugging code, and ensuring reproducibility.
4. Model Interpretation & Validation
A Statistical Modeling Associate must evaluate model performance, check assumptions, and interpret results correctly. Understanding diagnostics and validation techniques ensure statistical credibility.
5. Attention to Detail
Statistical work often supports research or regulatory decisions. Small mistakes can impact outcomes. Precision and careful documentation are essential.
6. Communication & Reporting
Statistical results must be translated into clear insights. The ability to explain methods, summarize findings, and prepare structured reports for non-technical stakeholders is a key professional skill.
Learning the right software used for statistical analysis helps professionals translate theoretical knowledge into practical analytical work.
Build job-ready statistical modeling skills
Conclusion
Understanding the tools used by a Statistical Modeling Associate helps bridge the gap between statistical theory and real-world application. Each tool serves a clear purpose, from preparing data to presenting results. Rather than mastering every available tool, focusing on the right ones leads to better analysis and confidence in the role. This practical understanding forms the foundation for growth in statistical modeling careers.
To build practical skills in statistical modeling and industry-relevant tools, CliniLaunch Research Institute offers a Advanced Diploma in Clinical SAS designed around real clinical research workflow. Enroll now to gain hands-on experience and role-focused training aligned with industry expectations.
A Statistical Modeling Associate works with data to build, validate, and interpret statistical models. They support analysis, reporting, and decision-making using statistical tools.
Core tools include SAS, R, and Python for modeling, along with Excel and SQL for data handling. Visualization and documentation tools support interpretation and reporting.
SAS is not mandatory in all roles, but it is highly preferred in clinical research and regulated industries. Many pharma and CRO roles expect SAS knowledge.
For beginners, tools like SPSS and Excel are easier to start with due to their user-friendly interfaces. As you progress, learning SAS, R, or Python is important for advanced statistical analysis and career growth.
Python is more flexible and widely used for automation and large-scale data analysis, while SAS is preferred in regulated industries like clinical research due to its reliability and compliance features.
SQL is used to extract and filter data from databases before analysis. It helps prepare the correct dataset for modeling in SAS, R, or Python.
Clinical research commonly uses SAS, R, and sometimes Python, with SAS being the most widely used due to regulatory compliance requirements.
Documentation ensures analysis is transparent, reproducible, and understandable. Reports and presentations explain how results were obtained.
Biostatisticians commonly use SAS, R, Python, and sometimes SPSS depending on analysis complexity and industry needs.
Beginners should focus on mastering one core tool along with data handling basics before expanding into advanced tools.